
Amazon SageMaker Data Wrangler for dimensionality reduction
Lab Introduction
- AWS experience: Intermediate
- Time to complete: 35 minutes
- AWS Region: US East (N. Virginia) us-east-1
- Cost to complete: 0.5~1$
- Services used: Sagemaker Canvas
Solution overview
- In the world of machine learning (ML), the quality of the dataset is of significant importance to model predictability.
- Although more data is usually better, large datasets with a high number of features can sometimes lead to non-optimal model performance due to the curse of dimensionality.
- Analysts can spend a significant amount of time transforming data to improve model performance. Additionally, large datasets are costlier and take longer to train. If time is a constraint, model performance may be limited as a result.
- Dimension reduction techniques can help reduce the size of your data while maintaining its information, resulting in quicker training times, lower cost, and potentially higher-performing models.
Overview of Principal Component Analysis
- Principal Component Analysis (PCA) is a method by which the dimensionality of features can be transformed in a dataset with many numerical features into one with fewer features while still **retaining **as much information as possible from the original dataset.
- This is done by finding a new set of features called components, which are composites of the original features that are uncorrelated with one another.
- Amazon SageMaker Data Wrangler is a purpose-built data aggregation and preparation tool for ML.
- Data Wrangler pre-built transformations: dimensionality reduction using Principal Component Analysis. With this new feature, you can reduce the high number of dimensions in your datasets.
1. Overview dataset
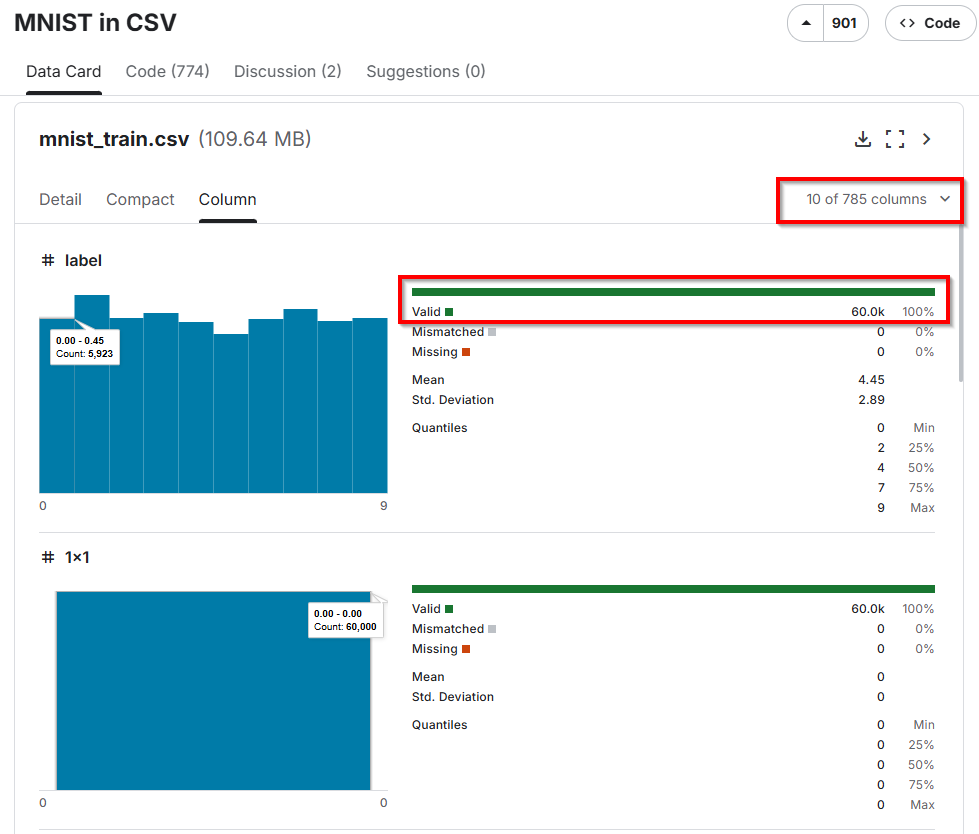
The MNIST dataset provided in a easy-to-use CSV format
The original dataset is in a format that is difficult for beginners to use.
The dataset consists of two files:
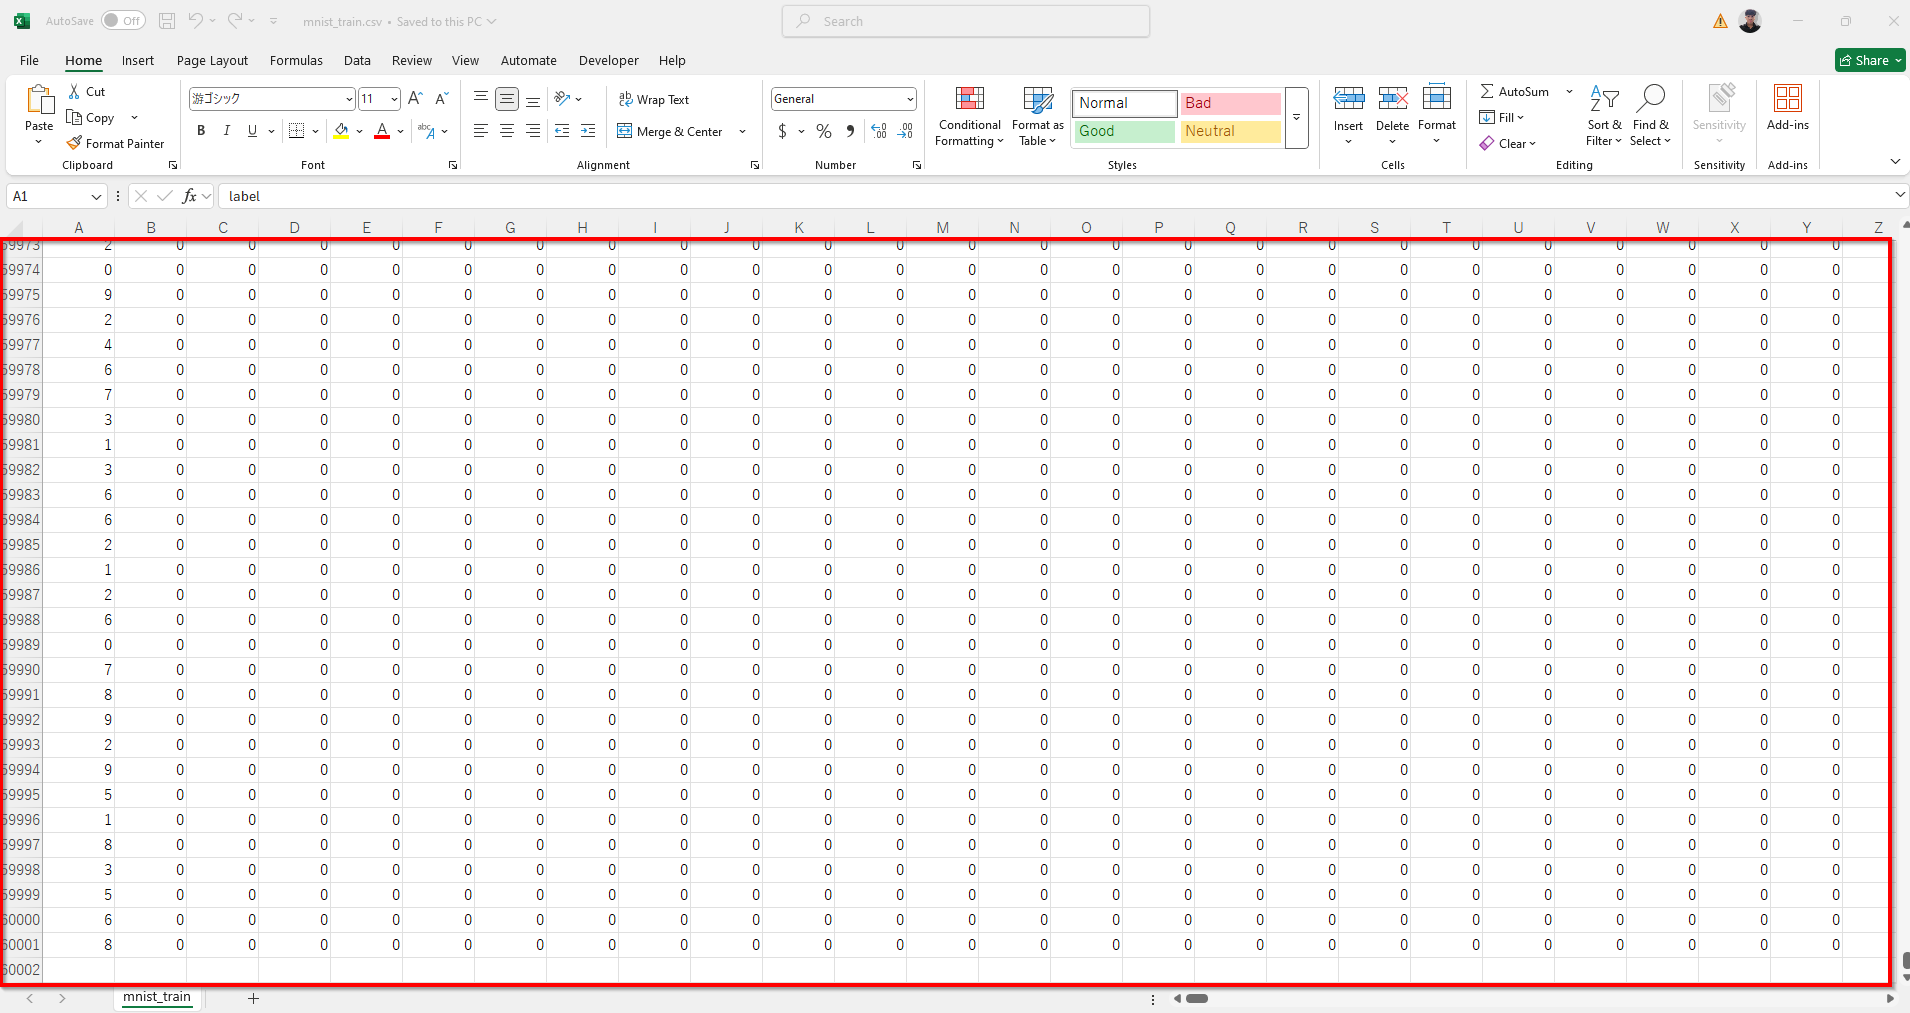
mnist_train.csvmnist_test.csv
The mnist_train.csv file contains the 60,000 training examples and labels. The mnist_test.csv contains 10,000 test examples and labels. Each row consists of 785 values: the first value is the label (a number from 0 to 9) and the remaining 784 values are the pixel values (a number from 0 to 255).
2. Download dataset & upload data into S3
- Download the https://drive.google.com/file/d/1N2LR6Ylk9YImJLA4QqXJPt3AQC-ES2J2/view?usp=sharing
- Extract the data from the .zip file in local machine/laptop.
3. Create Sagemaker Domain
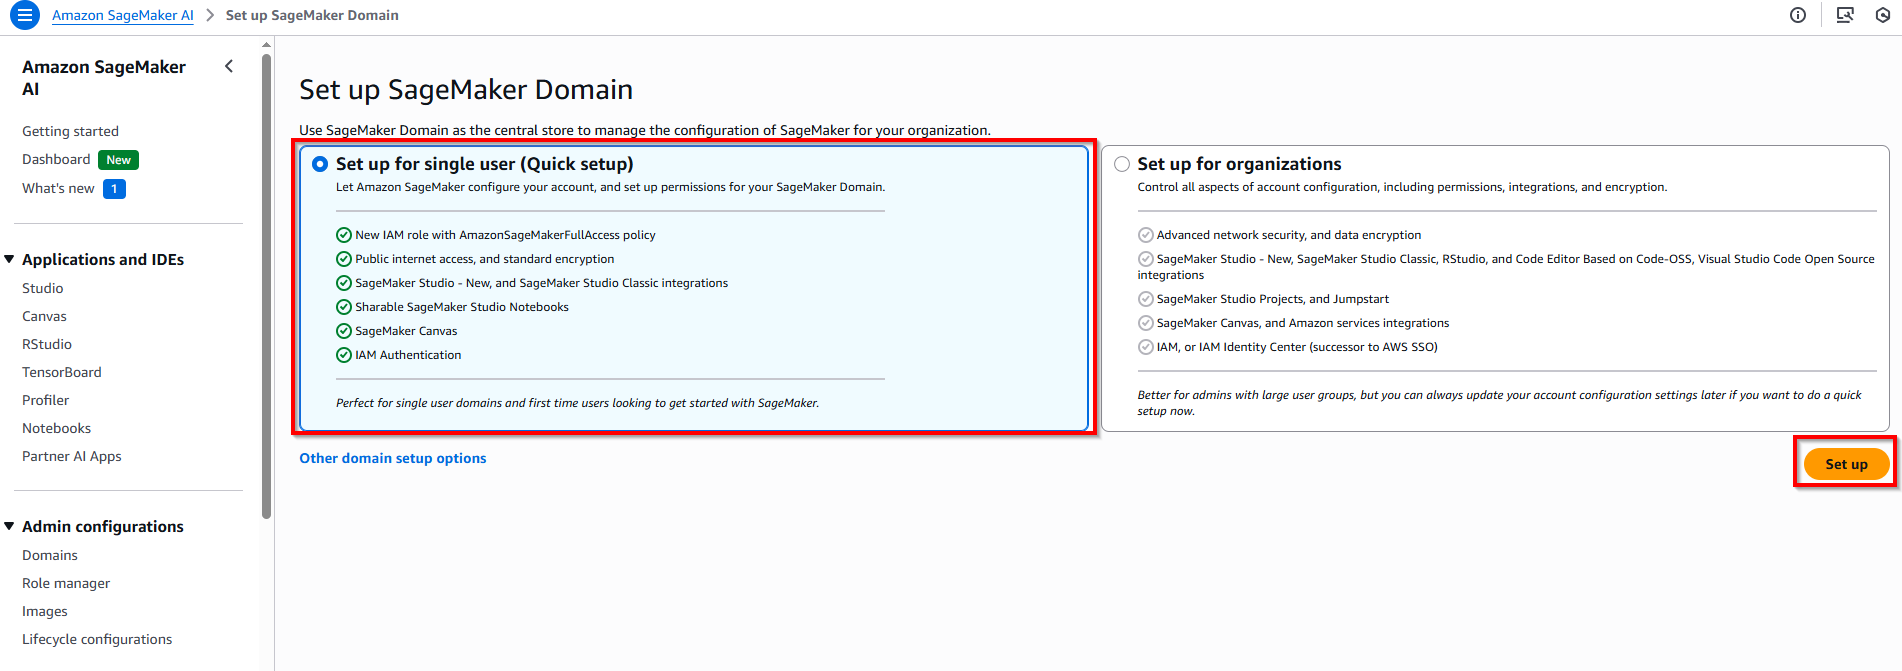
- Access Sagemaker AI service -> Domain -> Choose option Quick setup -> Choose button Set up.
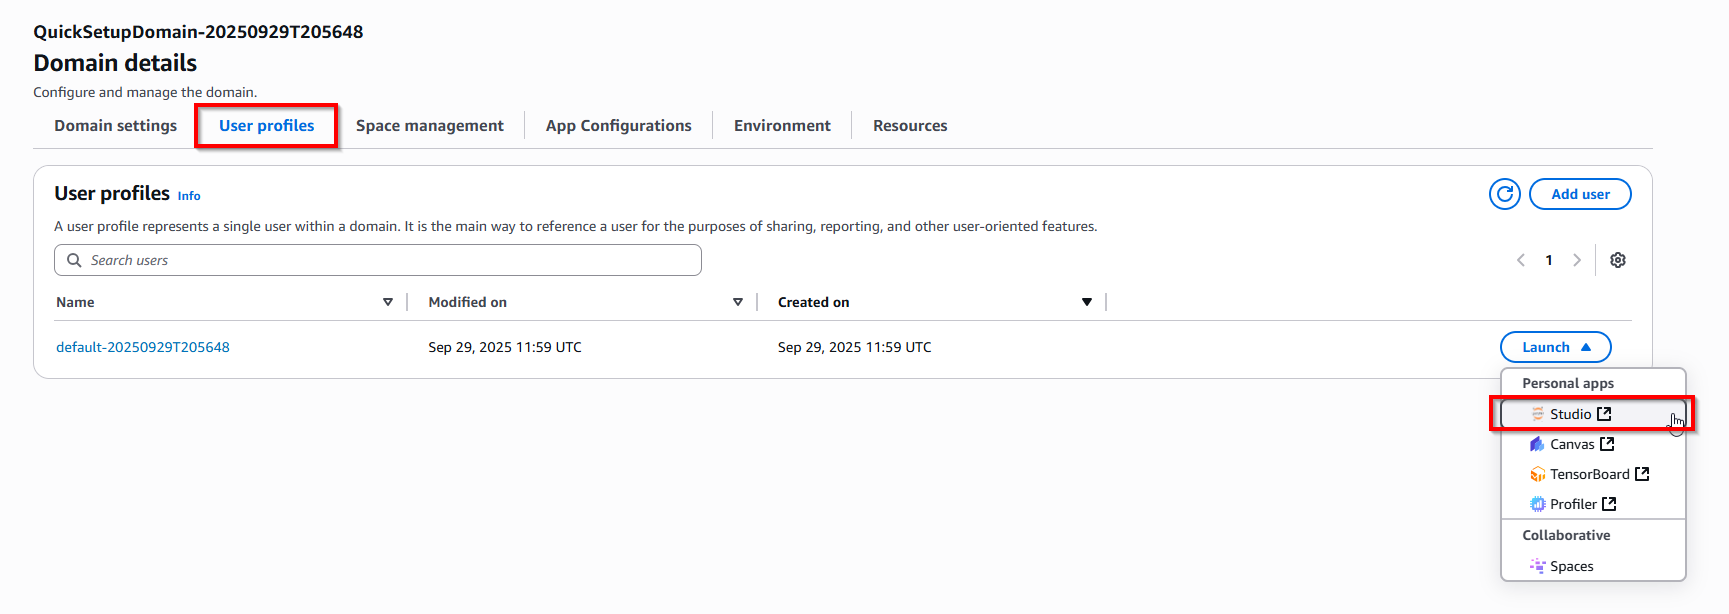
- Choose tab User profiles -> Click item Studio.
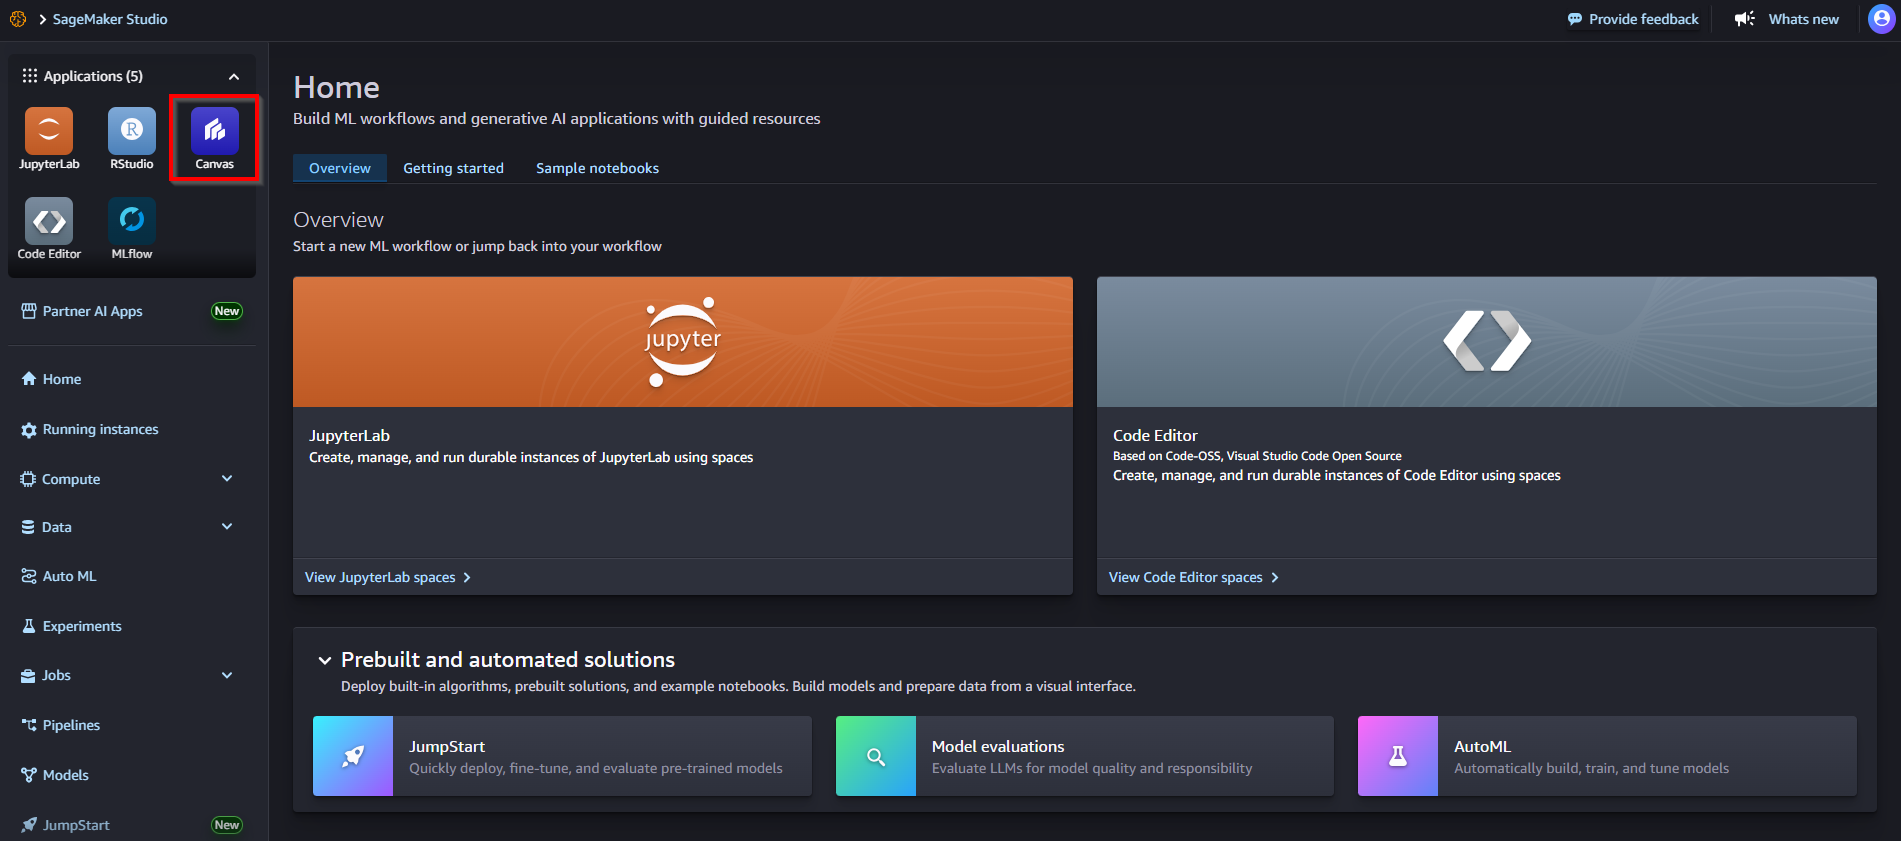
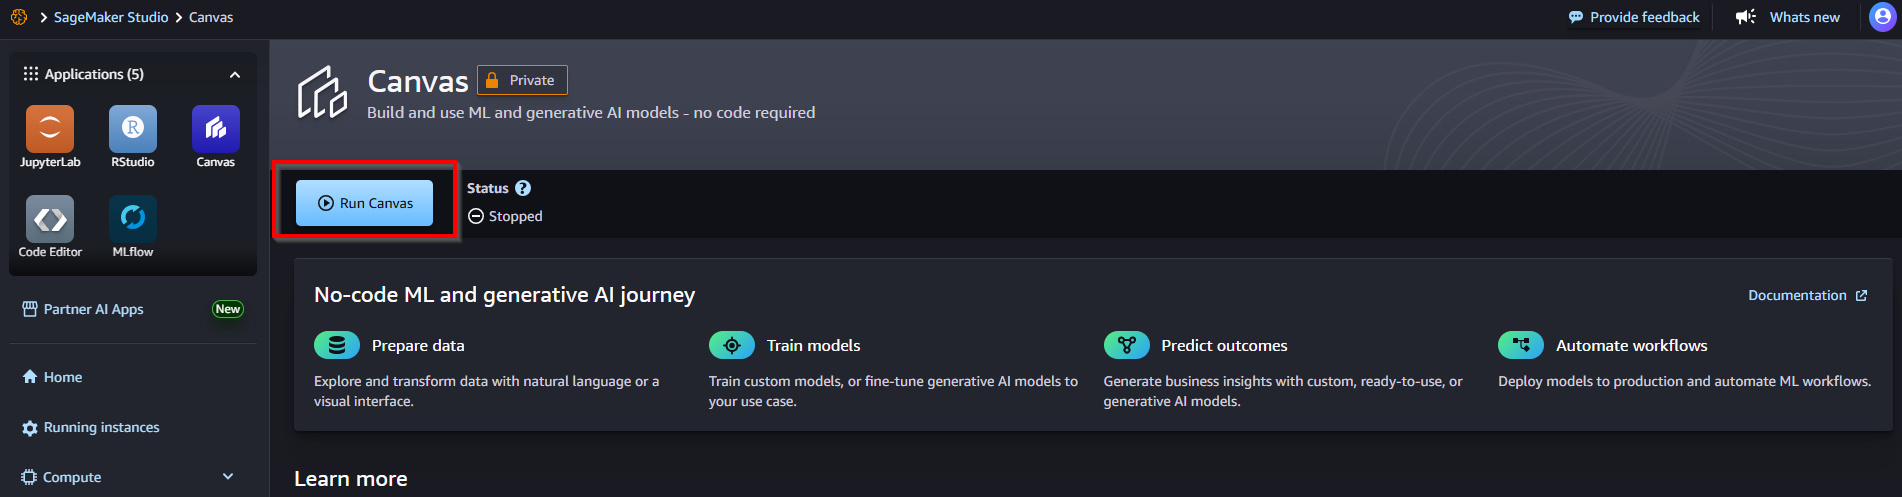
- In Sagemaker Studio dashboard, click icon Canvas -> Choose button Run Canvas
4. Perform a Quick Model analysis
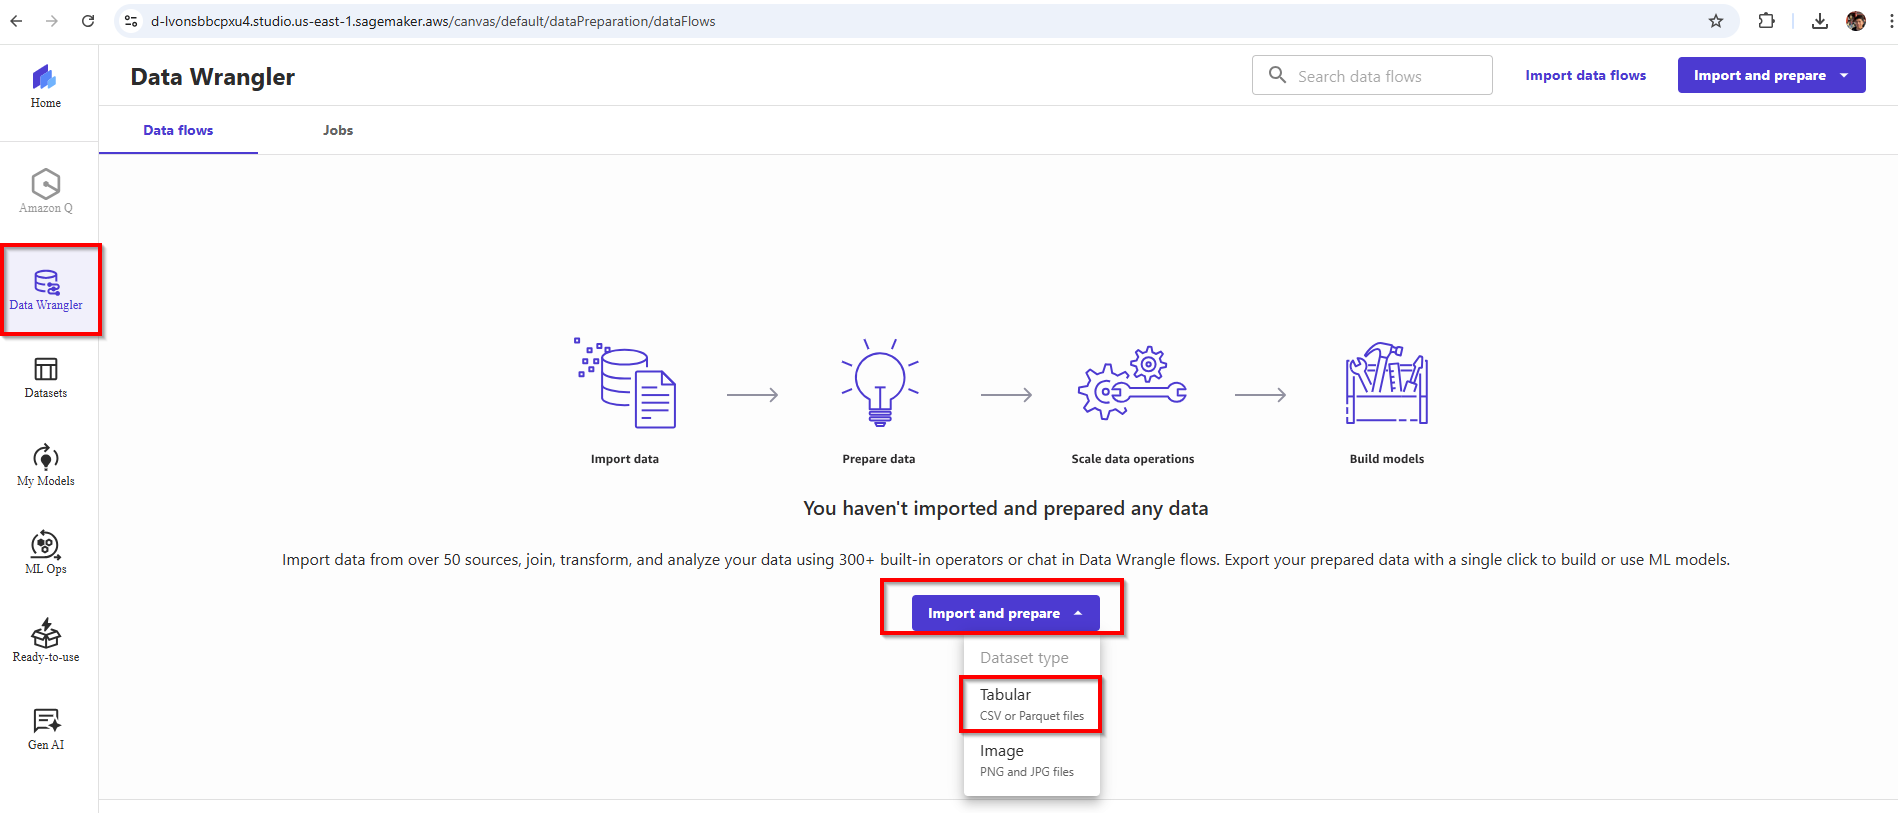
- In Canvas dashboard, choose icon Data Wrangler -> Choose button Import and prepare -> Choose option Tabular.
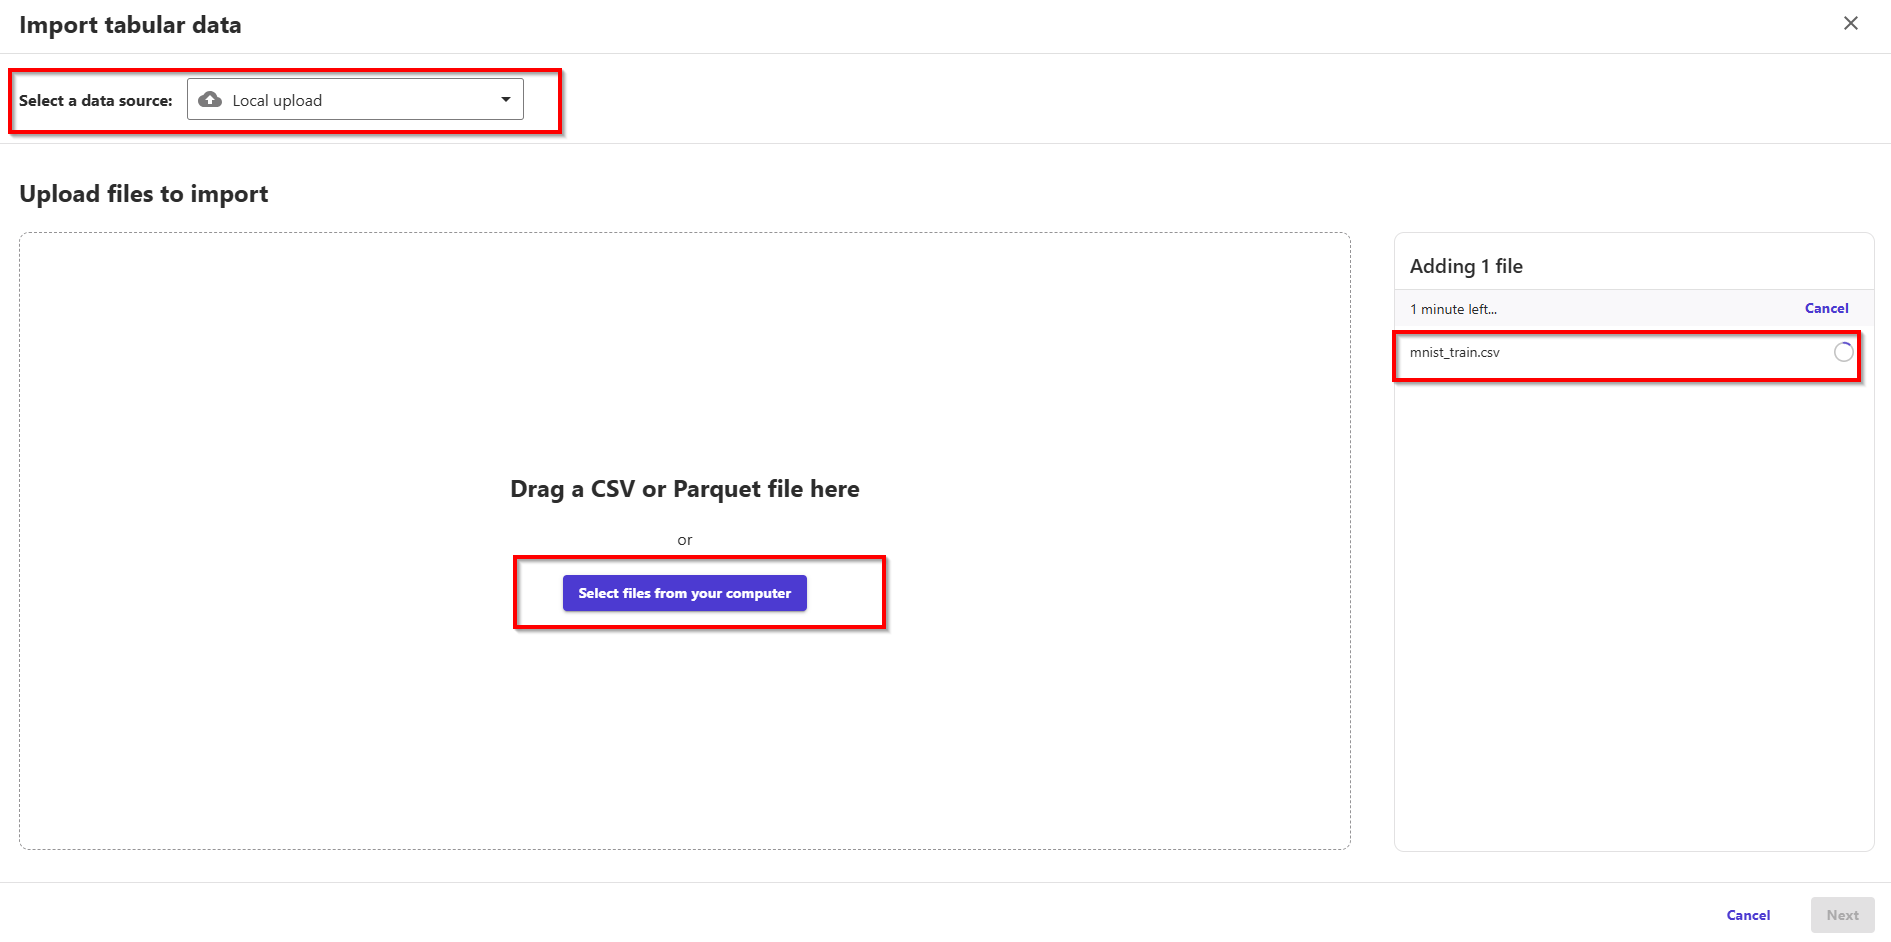
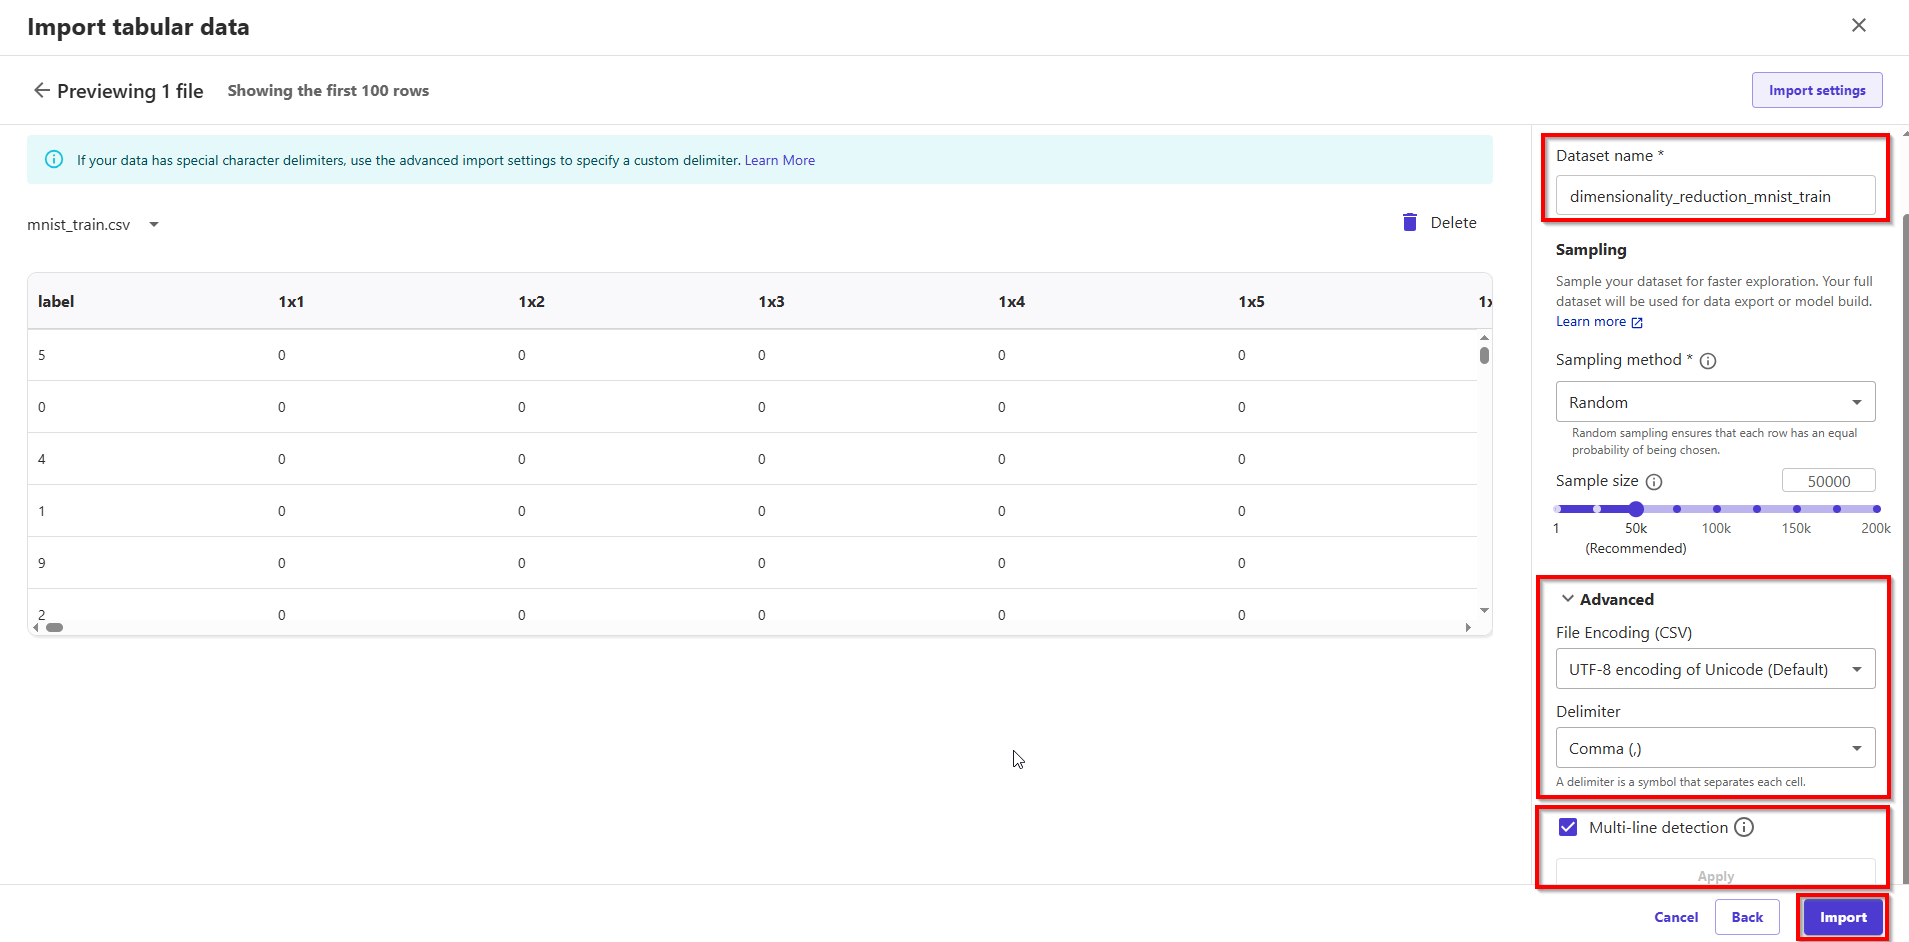
- In setting config Import tabular data, Select a data source: Local upload. Upload file: mnist_train.csv. Dataset name: dimensionality_reduction_mnist_train; Advanced: Choose UTF-8 encoding & check checkbox Multi-line detection. Finally, choose button Import.
- After the data is imported, Data Wrangler automatically validates the datasets and detects the data types for all the columns based on its sampling. In the MNIST dataset, because all the columns are long, we leave this step as is and go back to the data flow.
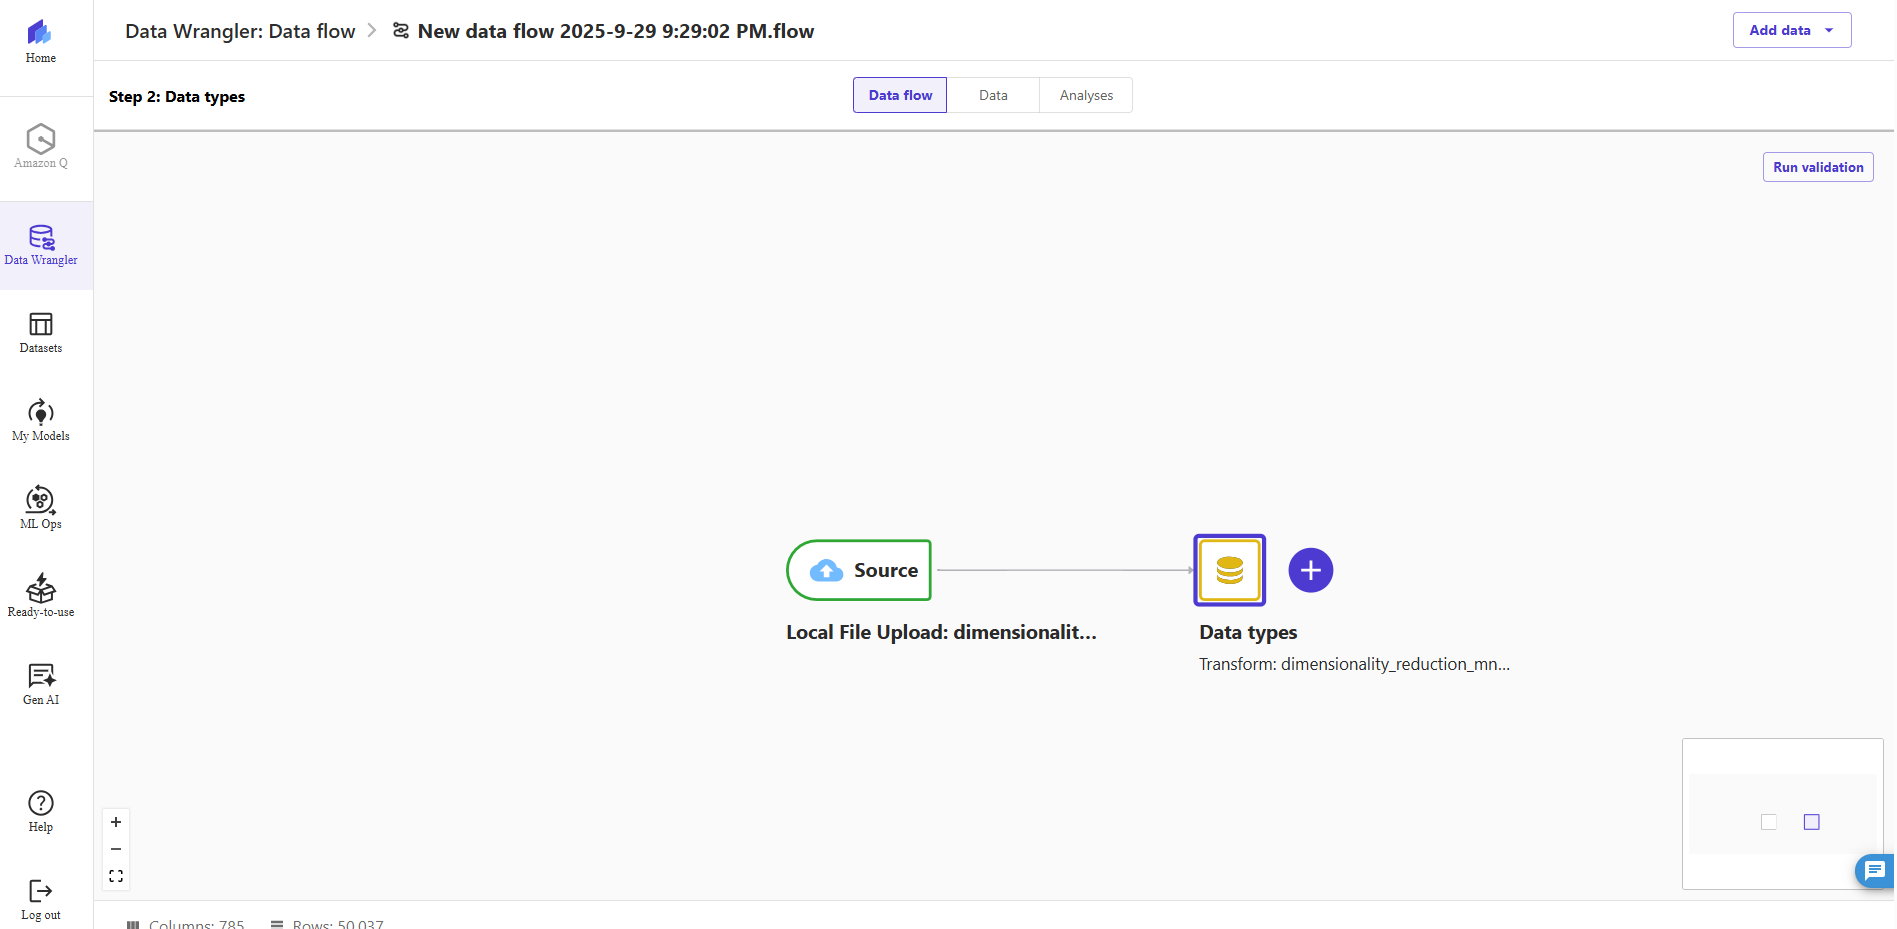
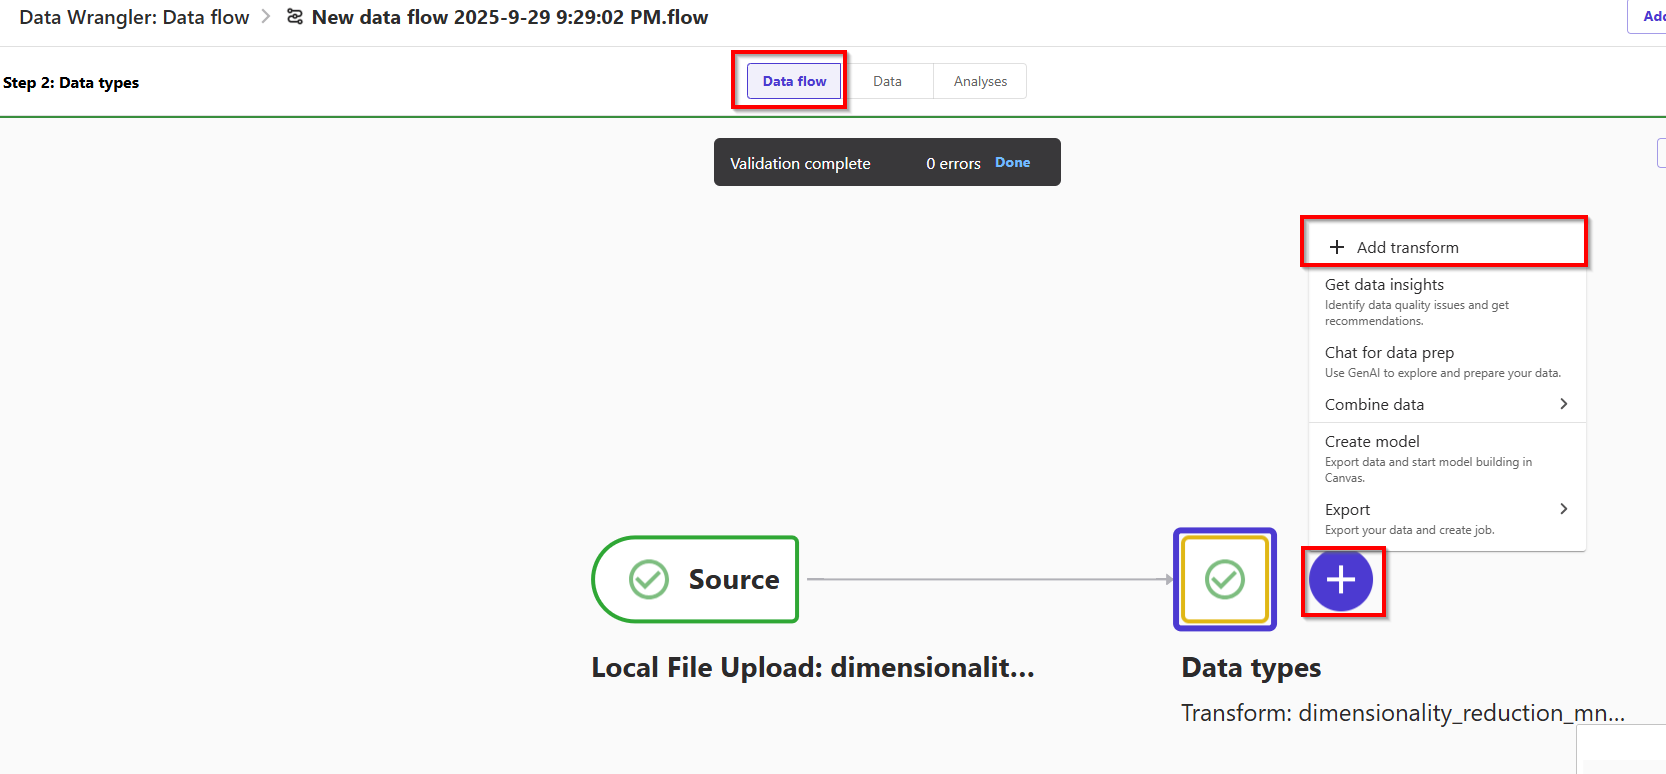
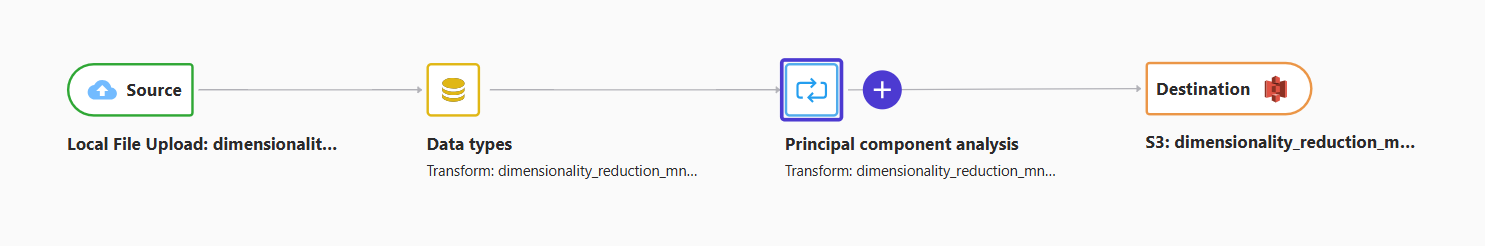
- The flow editor now shows two blocks showcasing that the data was imported from a source and the data types recognized. You can also edit the data types if needed.
- After confirming that the data quality is acceptable, we go back to the data flow and use Data Wrangler’s Data Quality and Insights Report. This report performs an analysis on the imported dataset and provides information about missing values, outliers, target leakage, imbalanced data, and a Quick Model analysis.
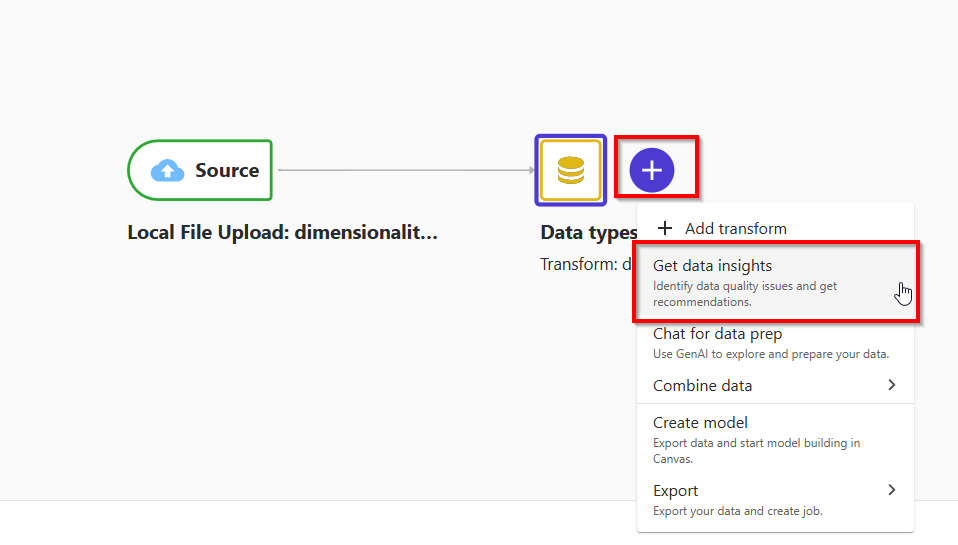
- Choose the plus sign next to Data types, then choose +, choose Get data insights.
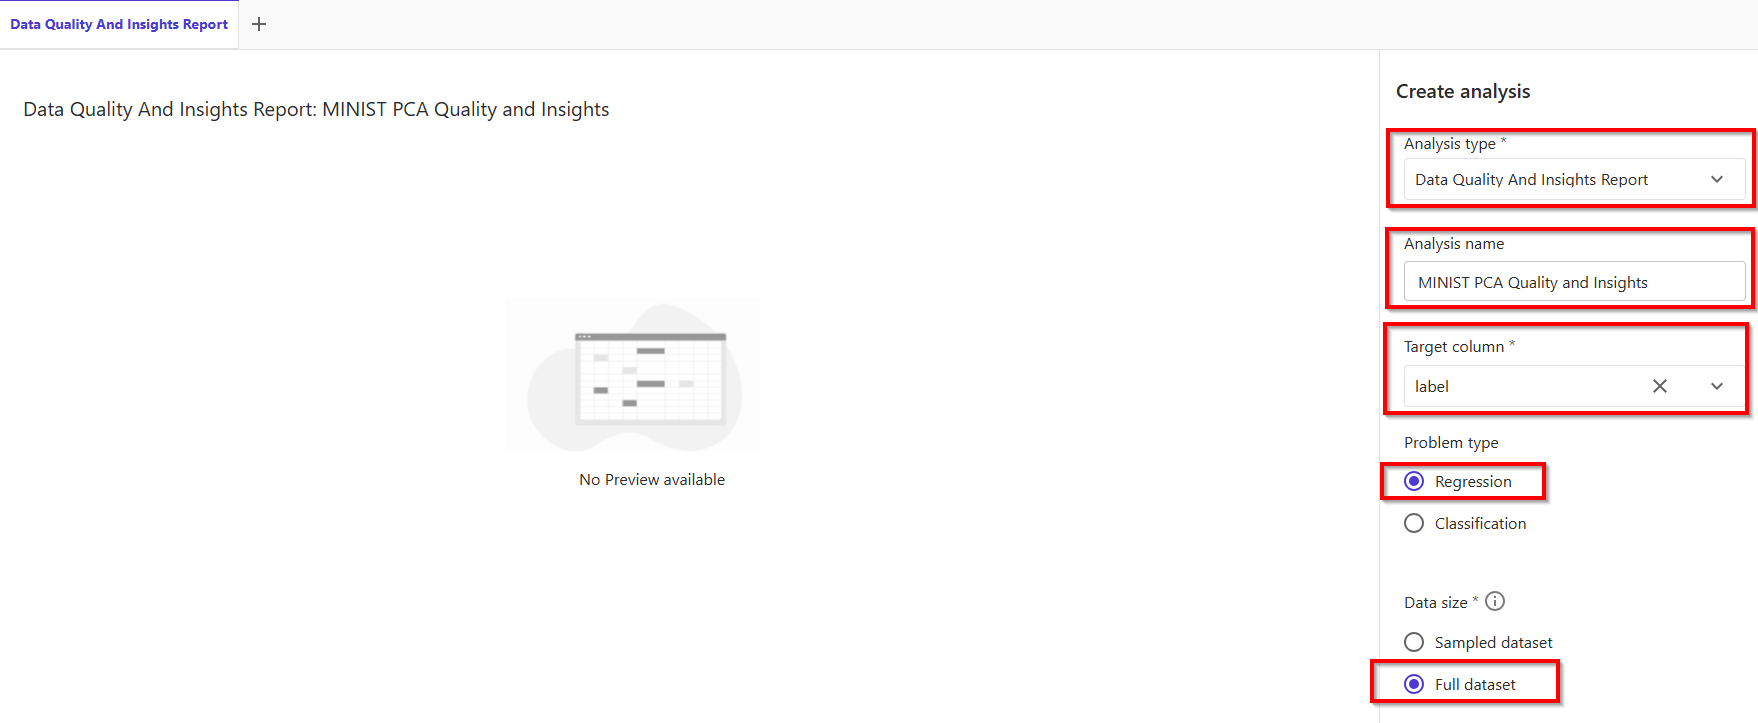
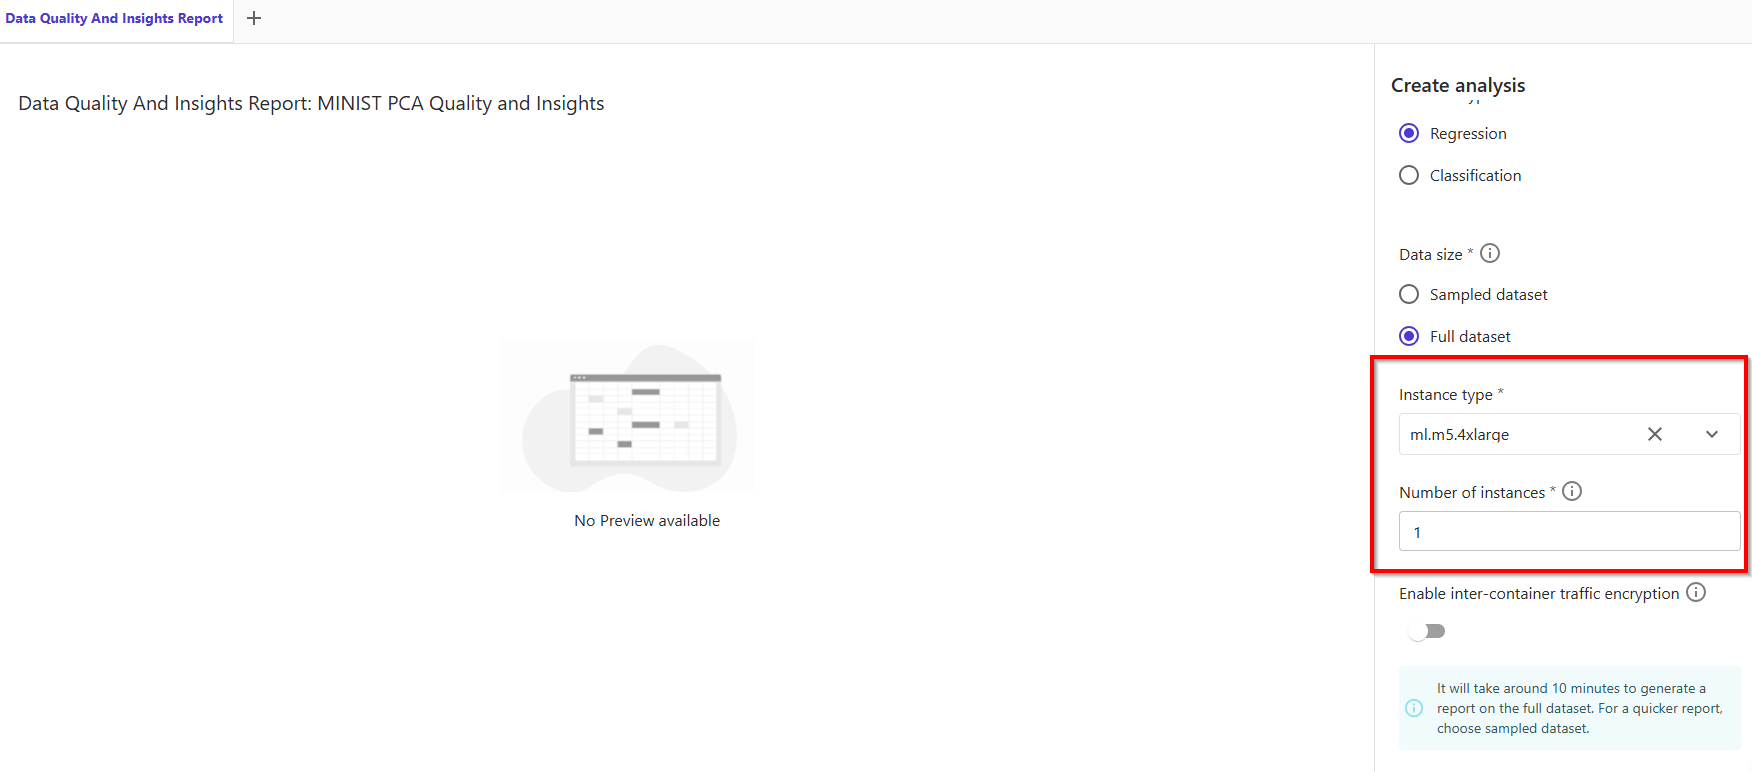
- In tab Create analytics, follow settings:
- Analysis type: Data Quality and Insights Report
- Analytics name: MINIST PCA Quality and Insights
- Target column: label
- Data size: Full dataset
- Instance type: ml.m5.4xlarge
- Number of instances: 1 or 2
- Problem type: Classification
- Finally, click button Create.
- The time taken for the report to generate depends on the size of the dataset, number of features, and the instance size used by Data Wrangler. Fortunately, we don’t have any missing values.
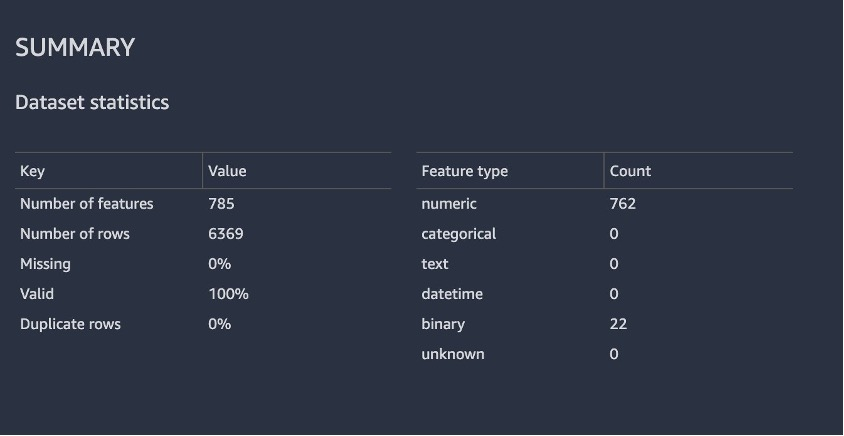
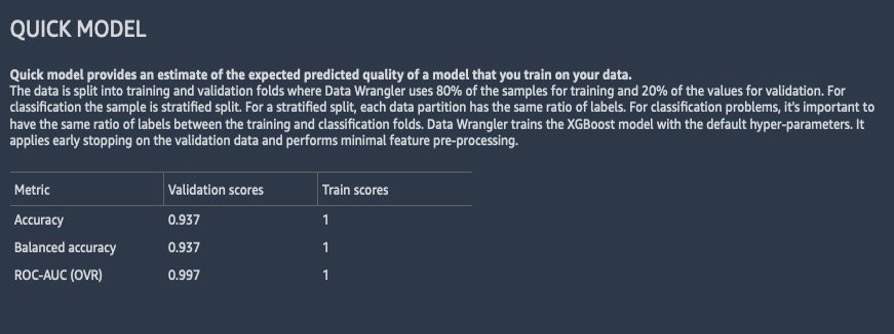
- The following screenshot shows how the model performed on the raw dataset. Here we notice that the model has an accuracy of** 93.7% utilizing 785 features.**
5. Use the Data Wrangler dimensionality reduction transform
Now let’s use the Data Wrangler dimensionality reduction transform to reduce the number of features in this dataset.
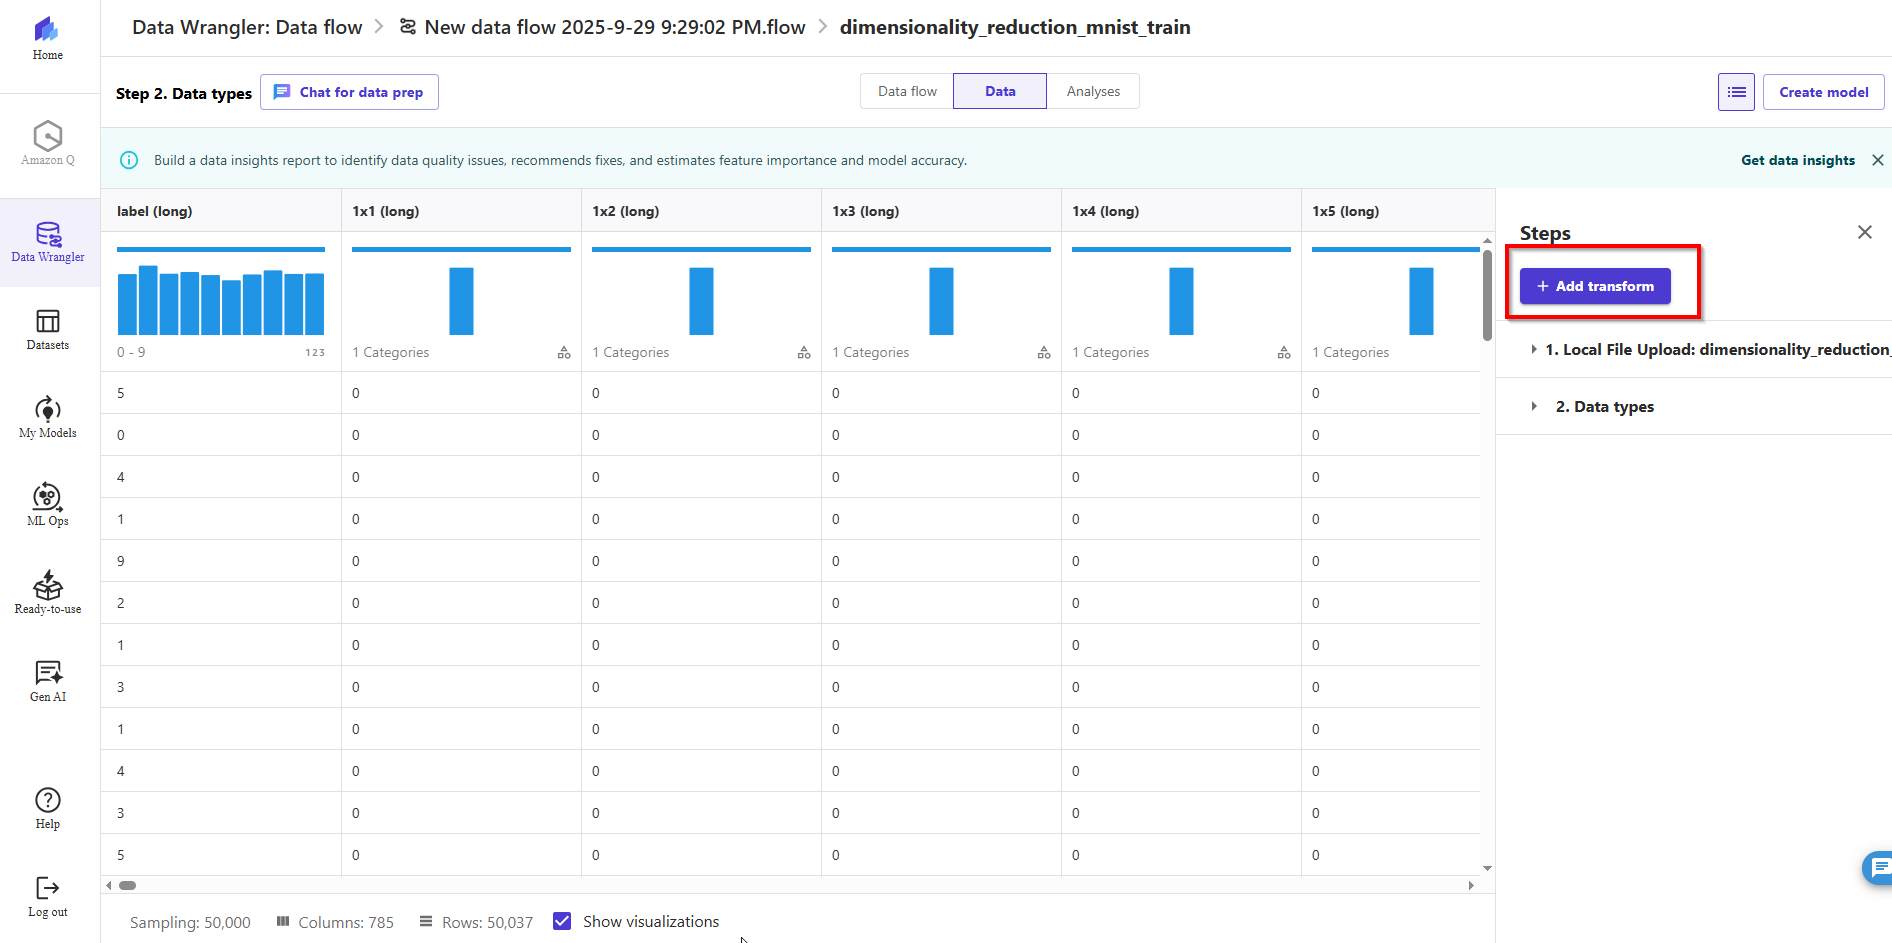
- On the data flow page, choose the plus sign next to Data types, then choose Add transform.
- Choose Add transform.
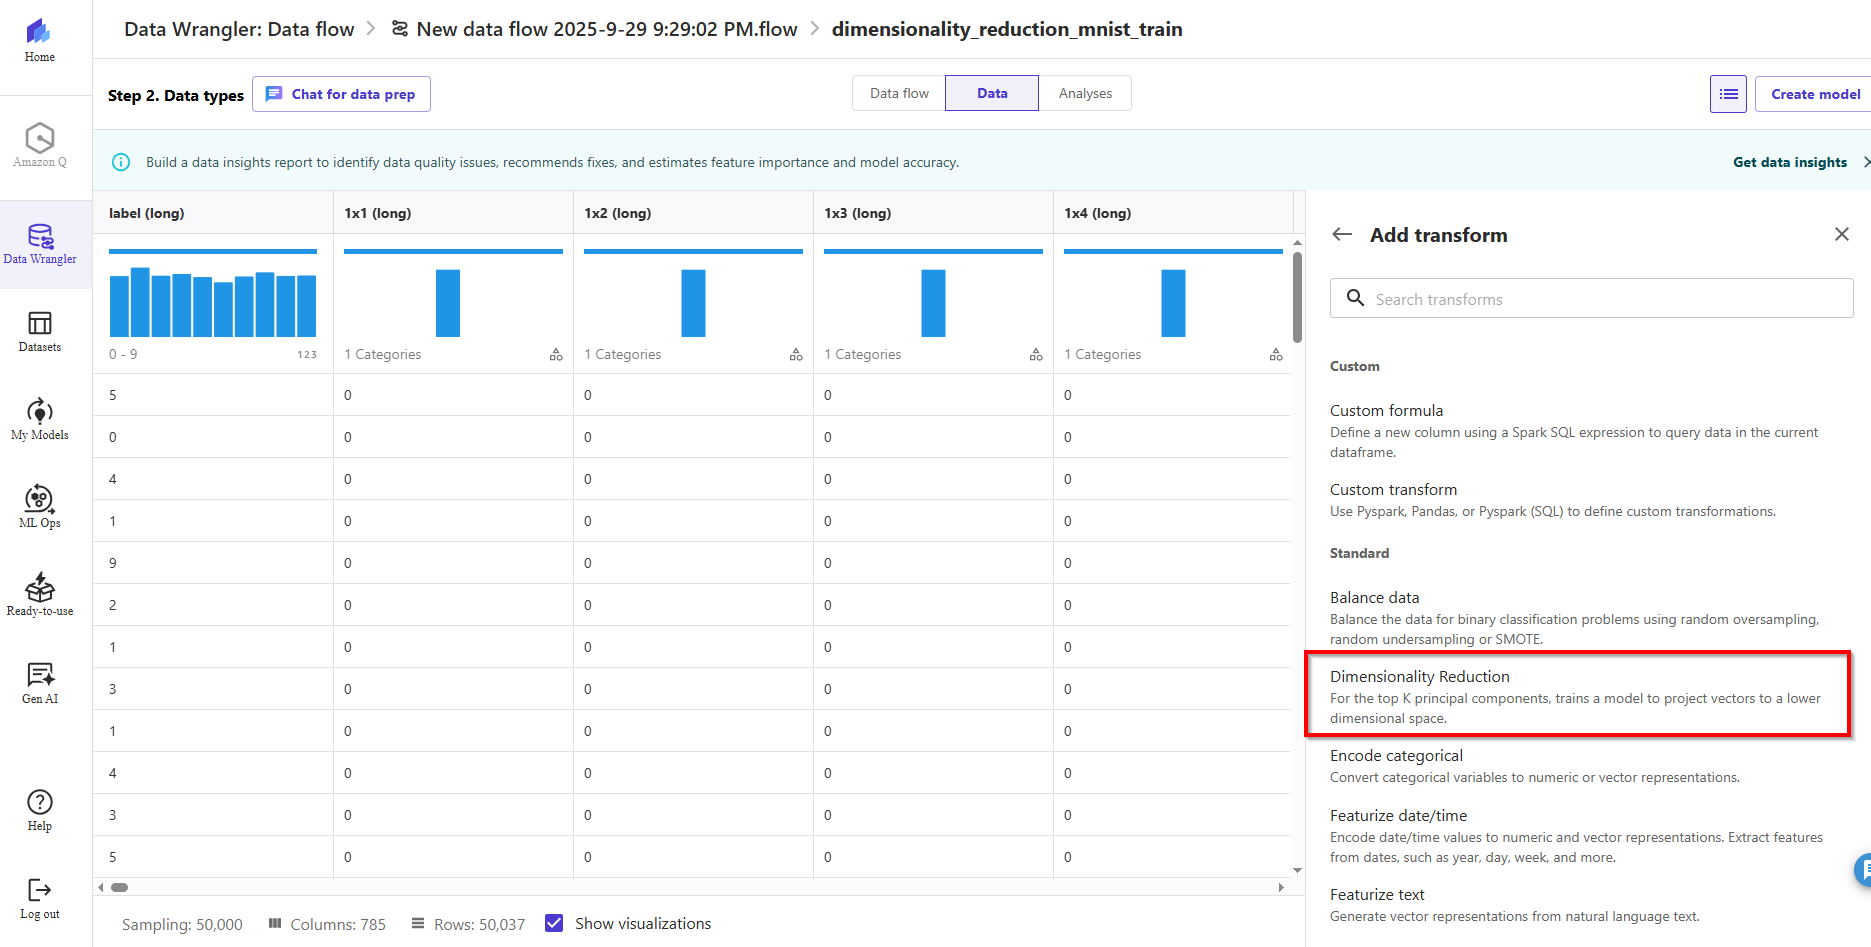
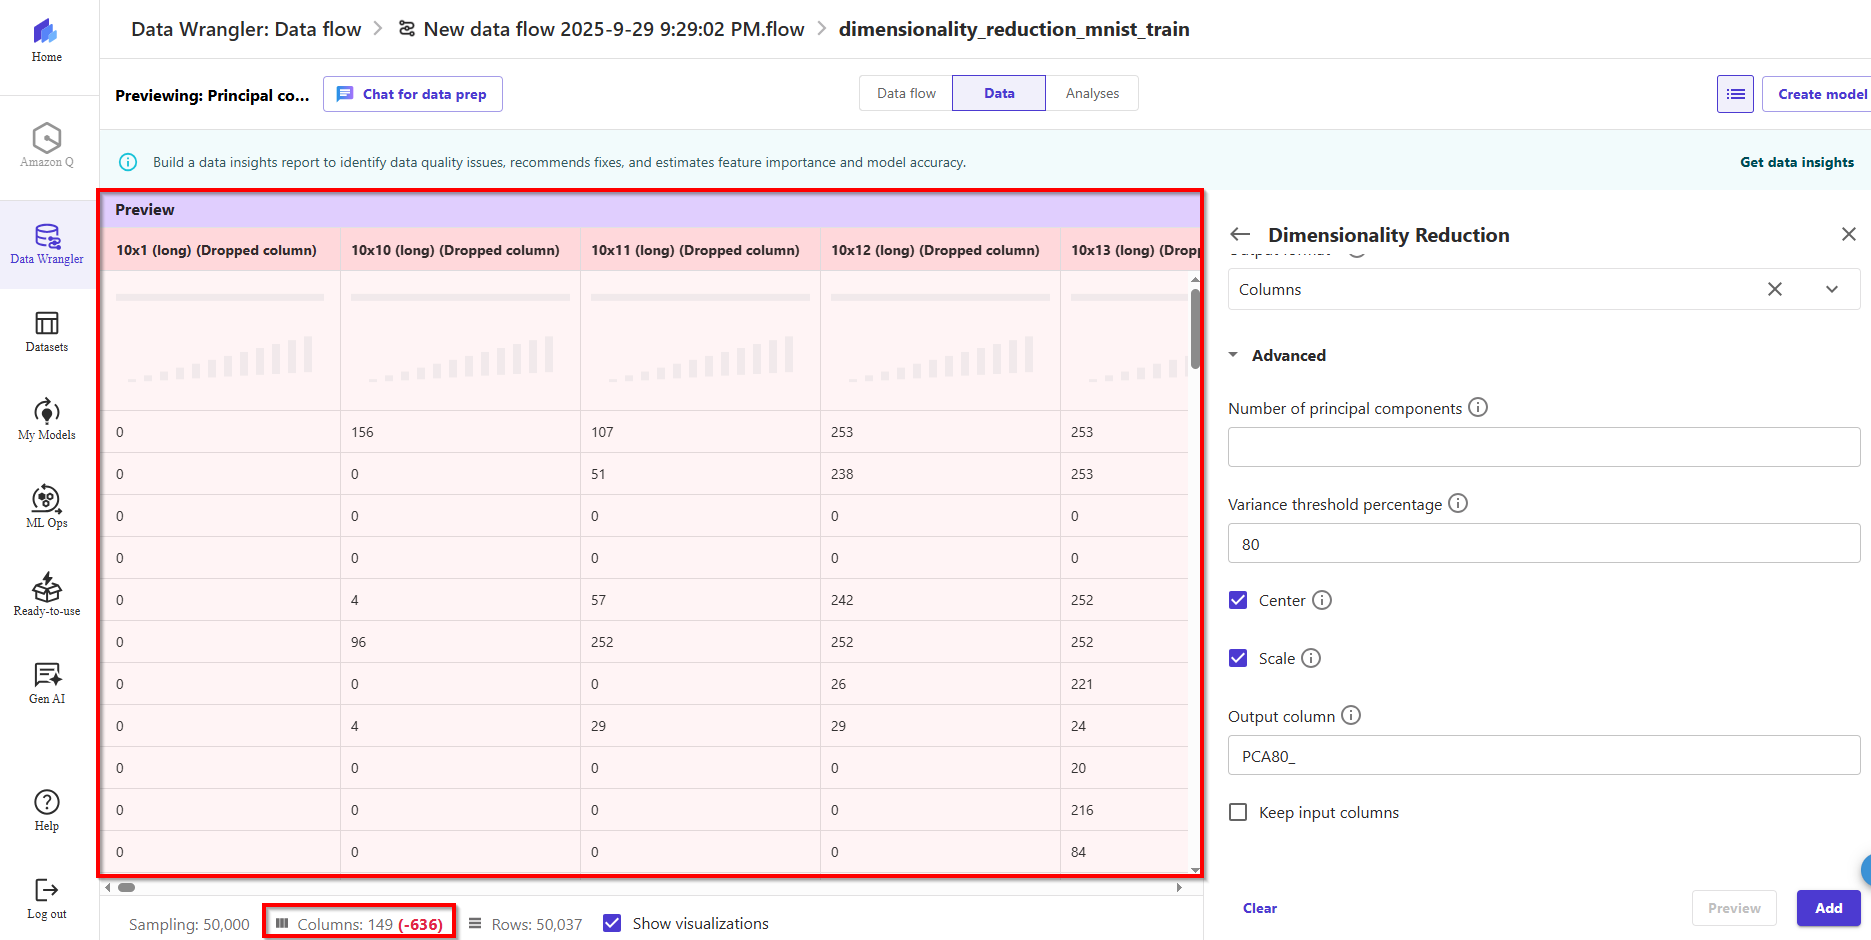
- Choose Dimensionality Reduction.
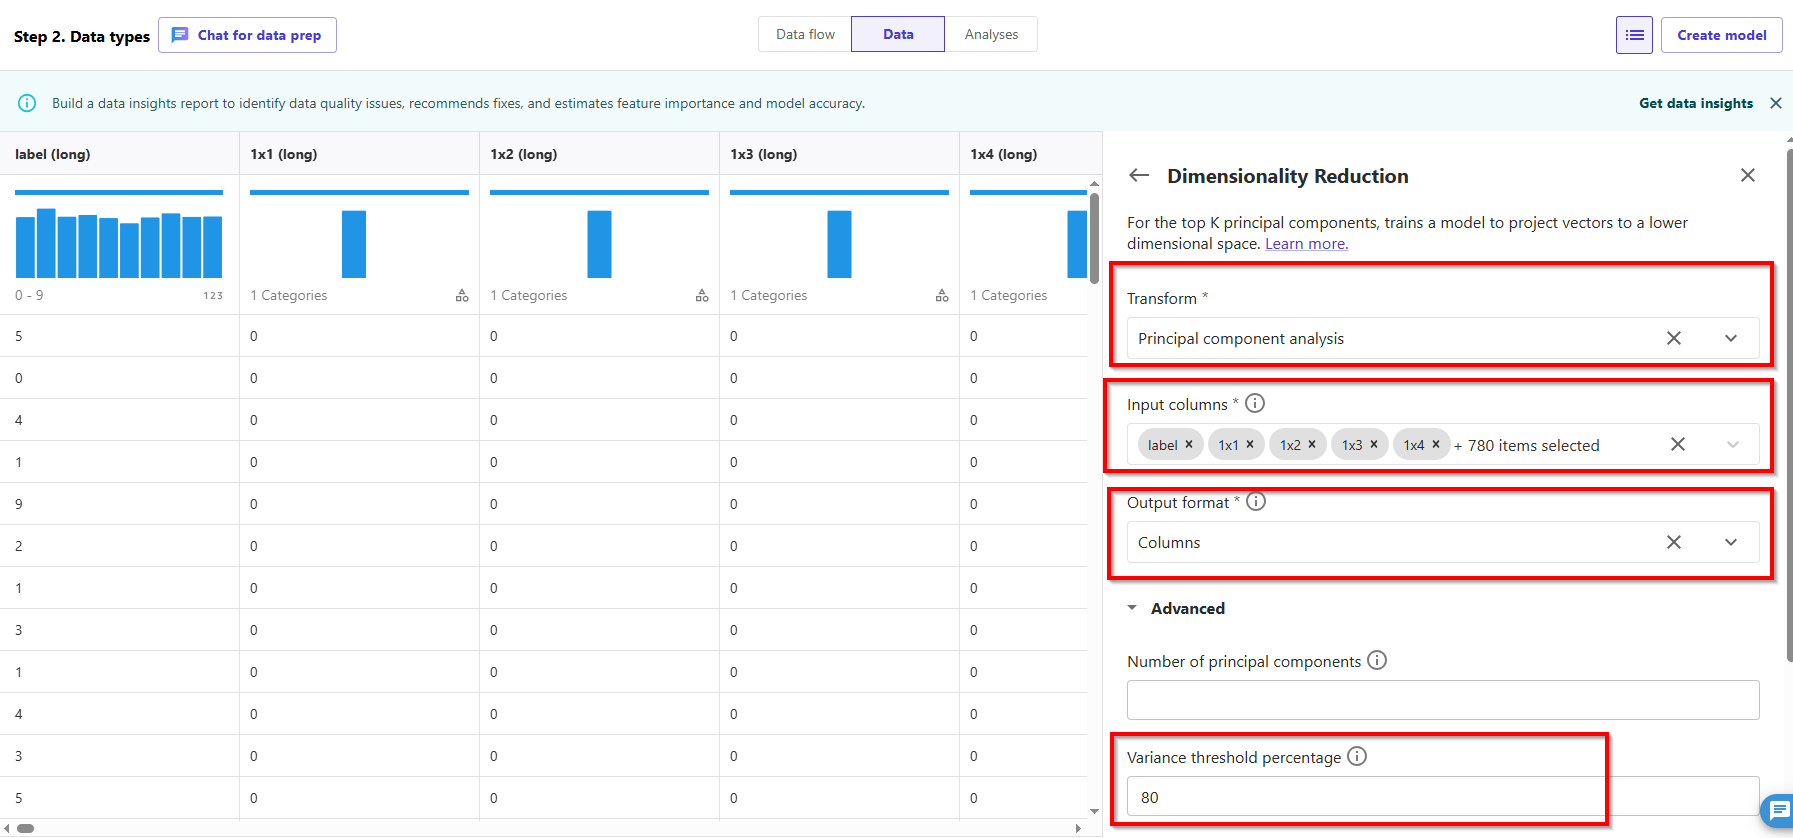
- Configure the key variables that go into PCA:
- For Transform, choose the dimensionality reduction technique that you want to use. We choose Principal component analysis.
- For Input Columns, choose the columns that you want to include in the PCA analysis. For this example, we choose all the features except the target column label (you can also use the Select all feature to select all features and deselect features not needed). These columns need to be of numeric data type.
- For Number of principal components, specify the number of target dimensions.
- For Variance threshold percentage, specify the percentage of variation in the data that you want to explain by the principal components. The default value is 95; we use 80.
- Select Center to center the data with the mean before scaling.
- Select Scale to scale the data with the unit standard deviation. PCA gives more emphasis to variables with high variance. Therefore, if the dimensions are not scaled, we will get inconsistent results. For example, the value for one variable might lie in the range of 50–100, and another variable is 5–10. In this case, PCA will give more weight to the first variable. Such issues can be resolved by scaling the dataset before applying PCA.
- For Output Format, specify if you want to output components into separate columns or vectors, we choose Columns.
- For Output column, enter a prefix for column names generated by PCA, enter PCA80_.
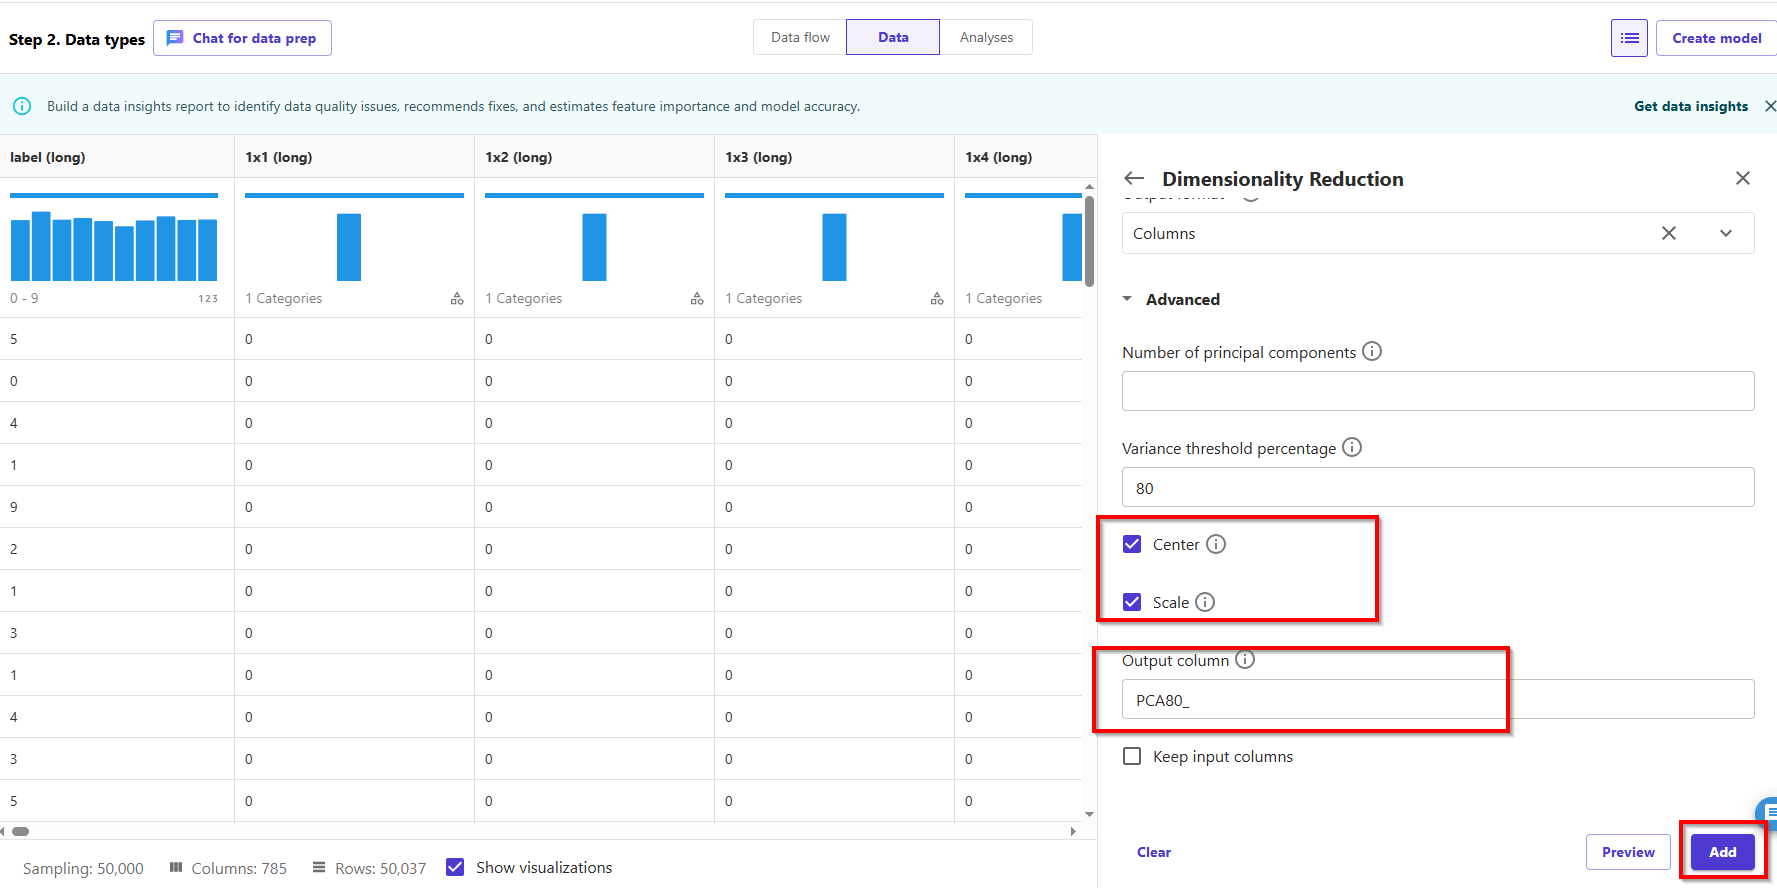
- Choose Preview to preview the data, then choose Add.
- After applying PCA, the number of columns will be reduced from 785 to 149—this is an 85% reduction in the number of features.
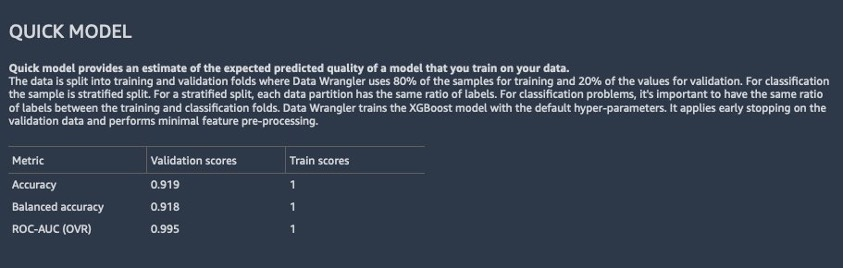
- We can now use the transformed dataset and generate another Data Quality and Insights Report as shown in the following screenshot to observe the model performance.
- We can see in the second analysis that the model performance has improved and accuracy increased to 91.8% compared to the first Quick Model report. **PCA reduced **the number of features in our dataset by 85% while maintaining the model accuracy at similar levels.
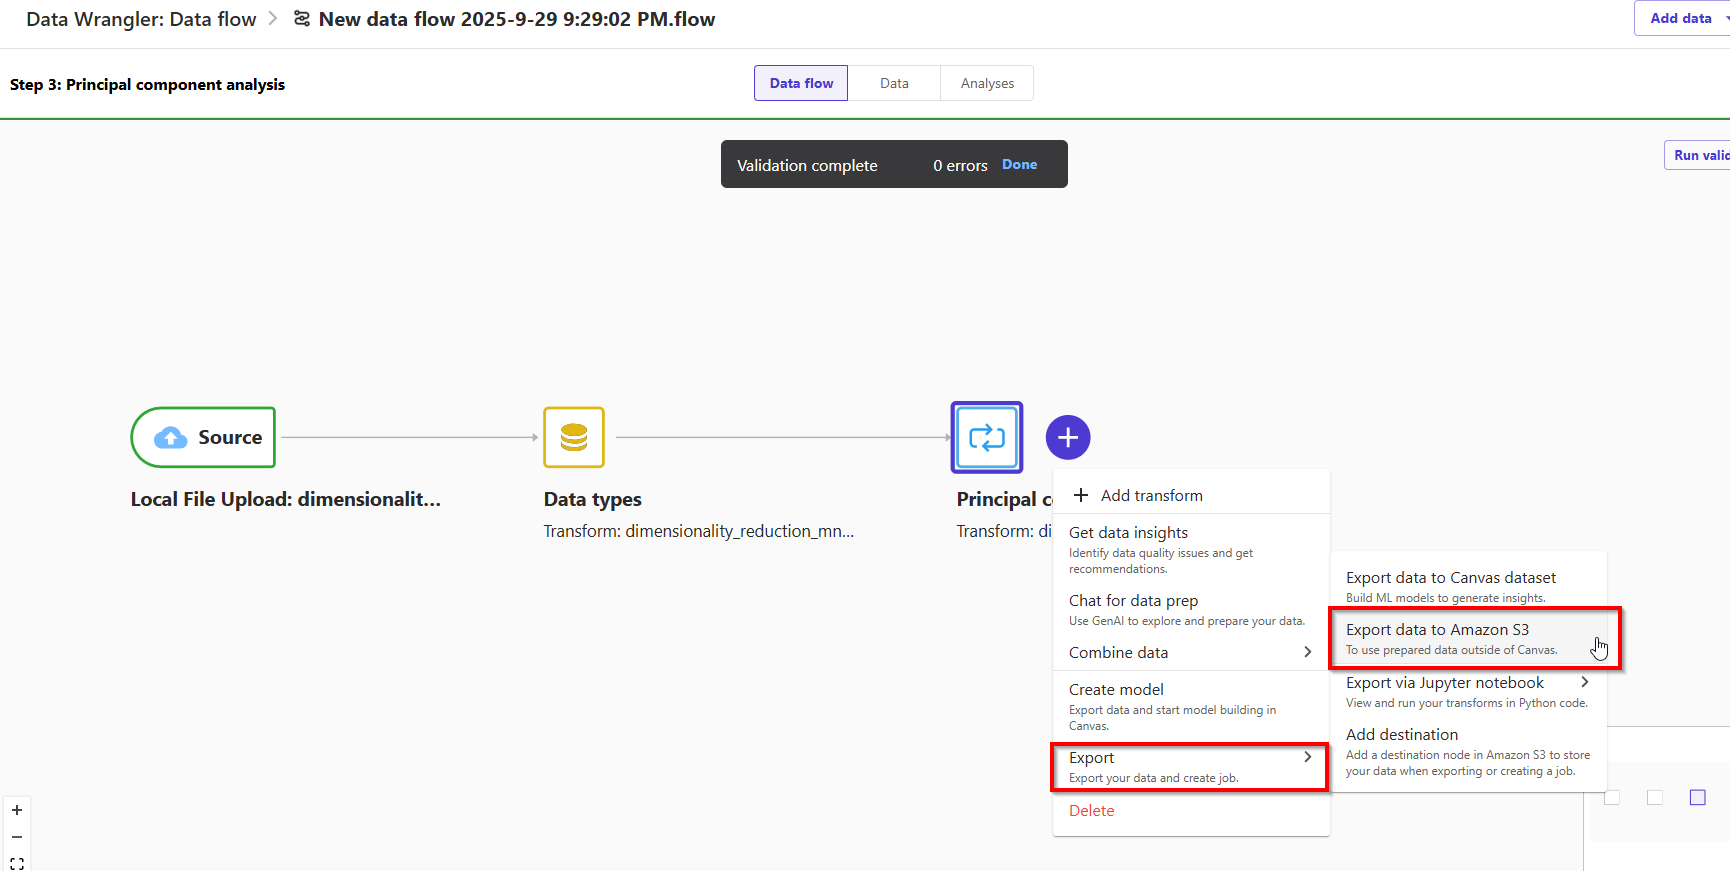
6. Operationalizing PCA
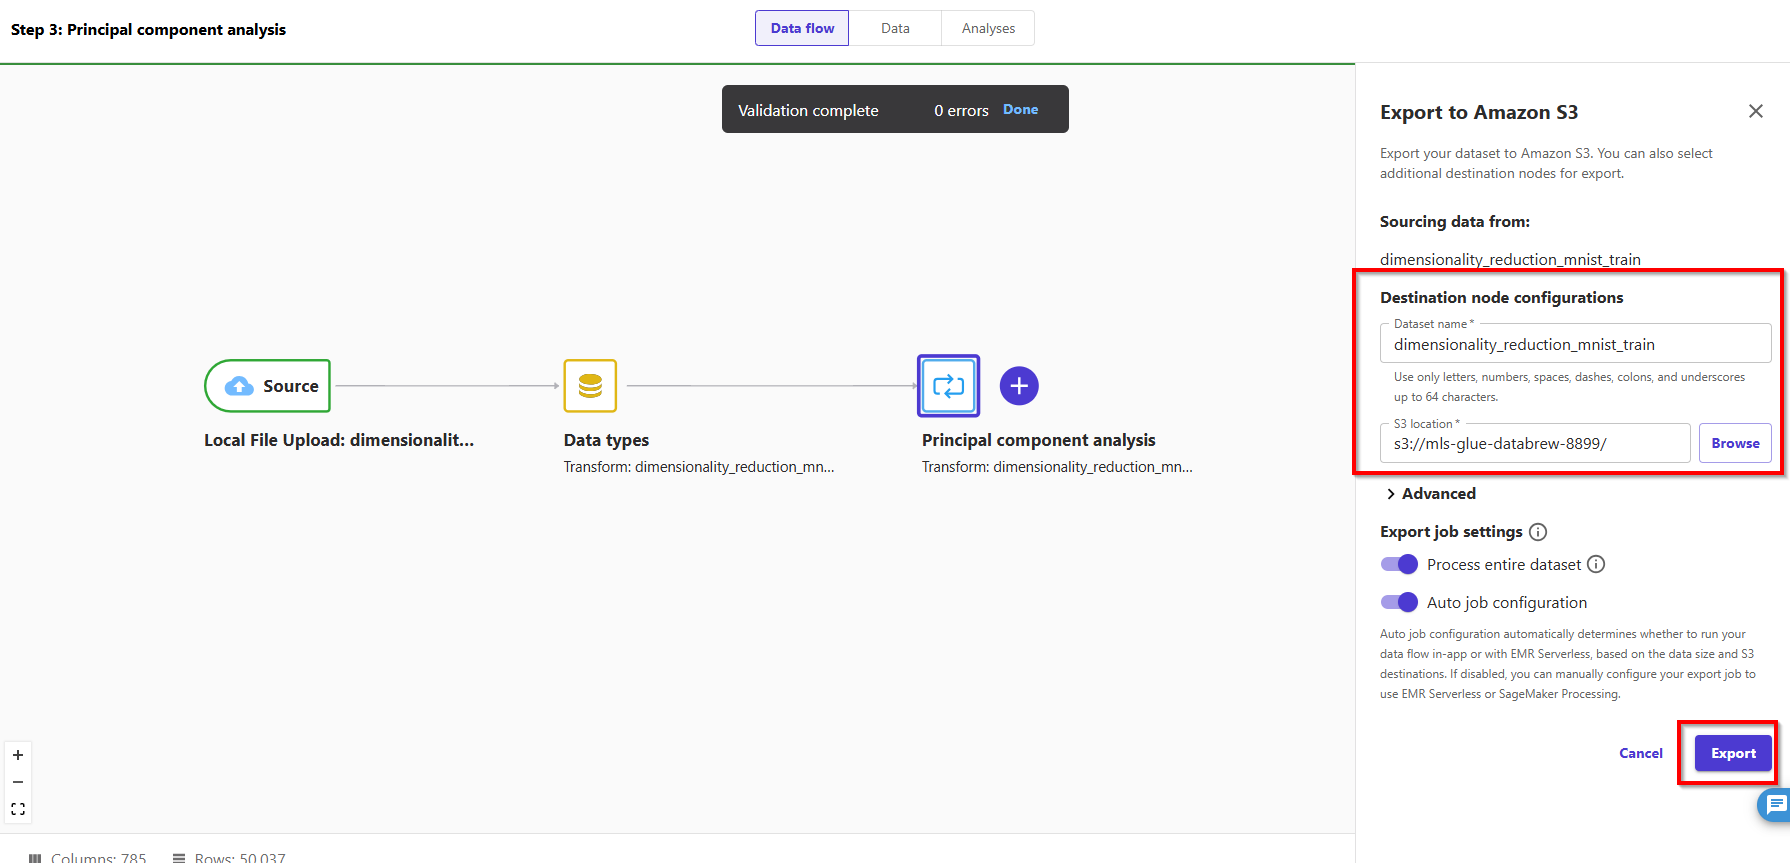
- Create a destination for our flow file in Amazon S3 so we can create a Data Wrangler processing job.
- Enter dataset name: dimensionality_reduction_mnist_train and choose button Export.
7. Clean up resources
- Delete Canvas.
- Delete Sagemaker domain.