
CloudWatch Agent - Cài đặt và cấu hình trên Amazon Linux 2023 - Thu thập Logs và Metrics từ EC2
Giới thiệu
Monitoring thông thường
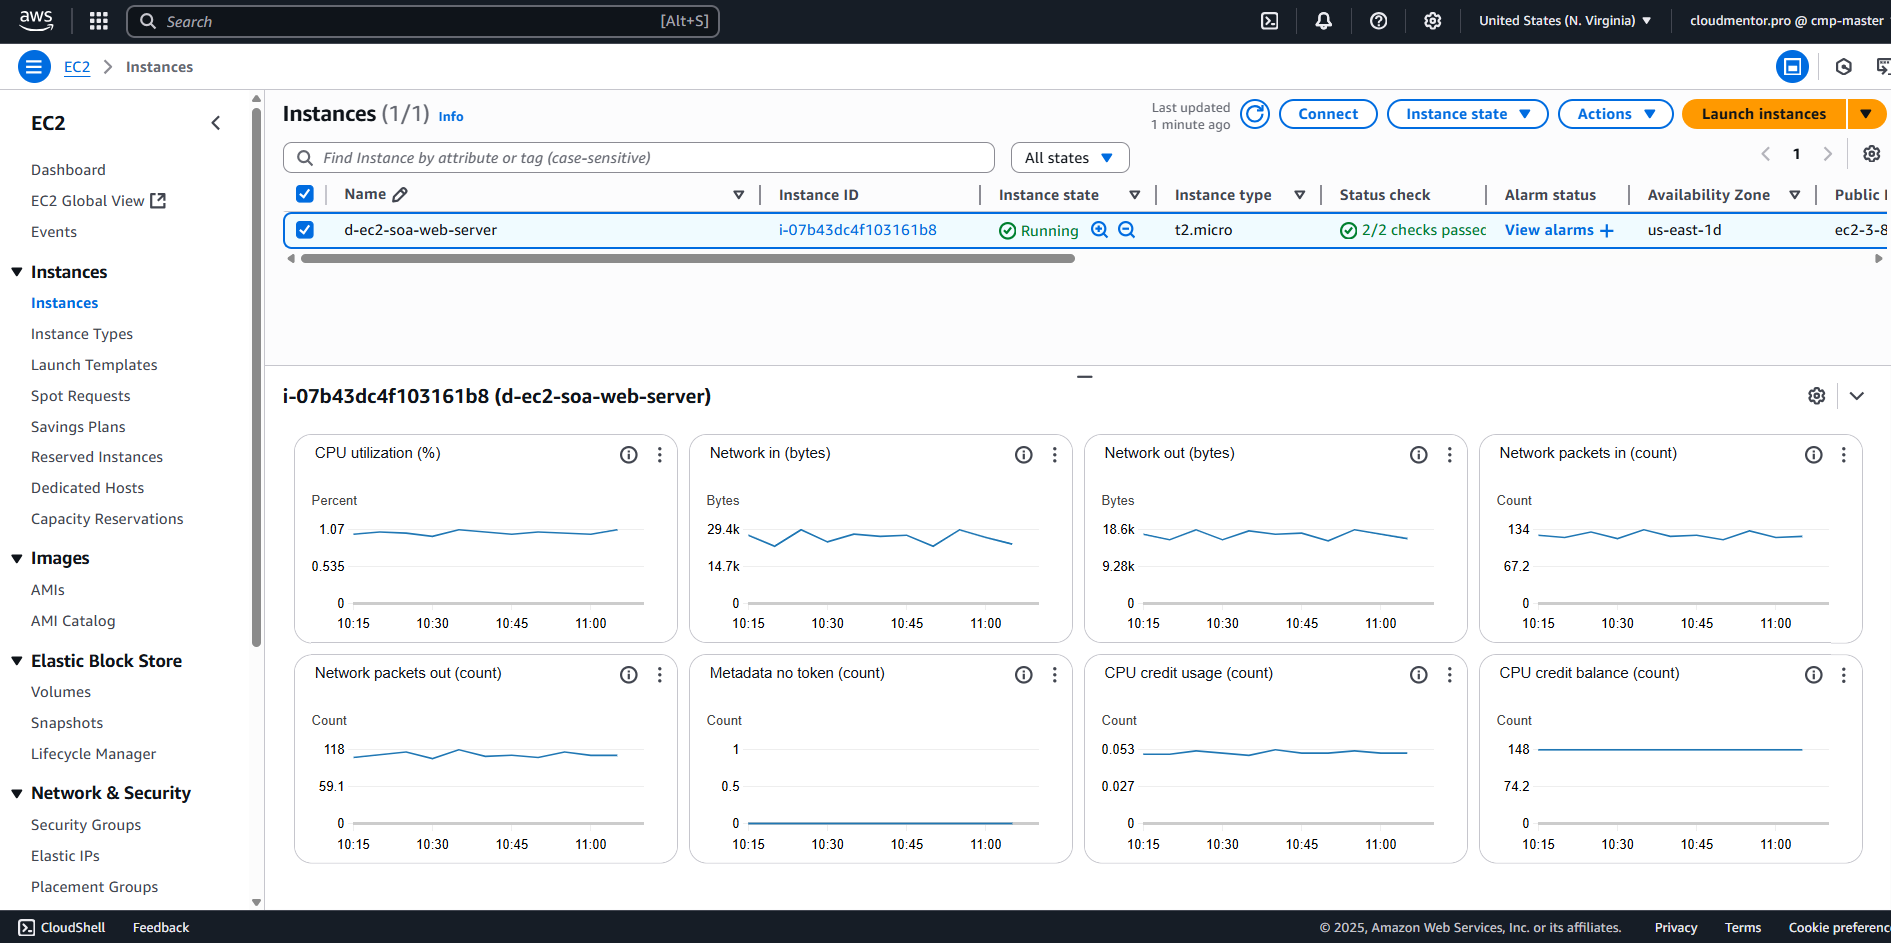
Khi chúng ta tạo một EC2 instance mà không cần cấu hình gì đặc biệt, chúng ta có thể thấy một số Metrics của instance đó trong tab Monitoring của EC2 instance. Tuy nhiên, các metrics như memory usage (sử dụng bộ nhớ) và disk usage (sử dụng ổ đĩa) v.v sẽ không được thu thập.
- CPU utilization (Sử dụng CPU)
- Status check failed (Kiểm tra trạng thái thất bại)
- Network in (Lưu lượng mạng đầu vào)
- Network out (Lưu lượng mạng đầu ra)
- Disk reads (Đọc ổ đĩa)
- Disk write (Ghi ổ đĩa)
- CPU credit usage (Sử dụng CPU credit)
- CPU credit balance (Số dư CPU credit)
CloudWatch Agent
Server monitoring của CloudWatch không sử dụng phương thức Pull như các hệ thống monitoring truyền thống (cài đặt agent trên server cần giám sát và được quản lý từ management server), mà sử dụng phương thức Push - agent gửi metrics hoặc logs đến CloudWatch.
Khi sử dụng CloudWatch để thực hiện server monitoring cho EC2, việc giám sát bằng standard metrics (metrics tiêu chuẩn) khá hạn chế. Mặc dù có thể giám sát CPU usage bằng standard metrics, nhưng để giám sát memory usage, disk usage và các metrics khác, cần phải cài đặt CloudWatch Agent và cấu hình để thu thập custom metrics.
Các Metric mà CloudWatch Agent có thể gửi tại đây
Các ứng dụng chạy trên EC2 mặc định cũng ghi log tại chính server EC2, vì vậy nếu muốn thực hiện gửi log đến CloudWatch cho các mục đích liên kết khác (search, filter, Export đến S3 vv) thì chúng ta cũng cần đến CloudWatch Agent.
Lab Introduction
- AWS experience: Intermediate
- Time to complete: 20 minutes
- AWS Region: US East (N. Virginia) us-east-1
- Cost to complete: Free Tier eligible
- Services used: EC2, CloudWatch, IAM
Prerequisites
- AWS Account với quyền Admin
- Kiến thức cơ bản về EC2 và IAM
- SSH để connect vào EC2
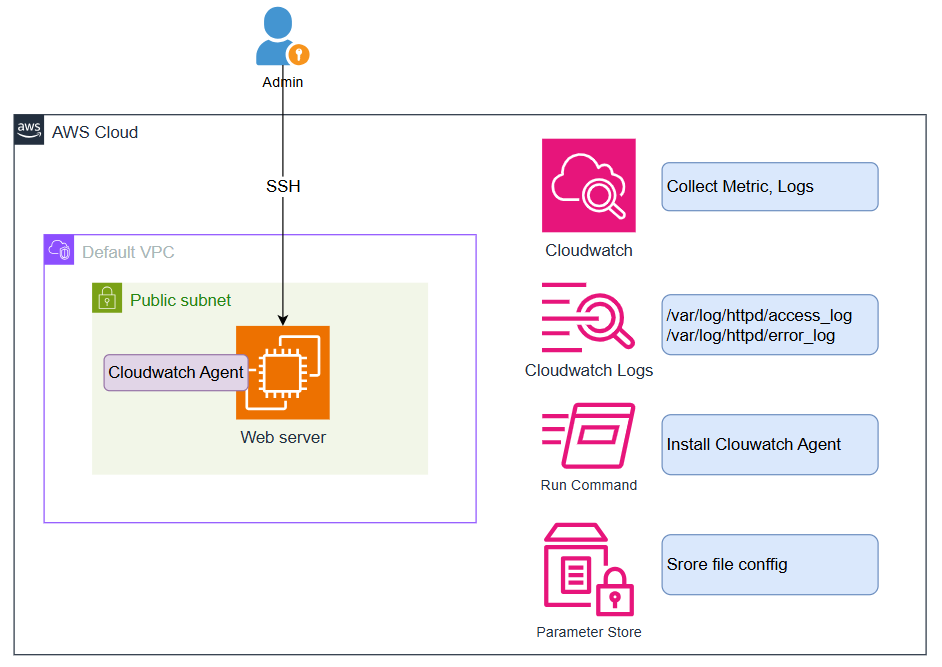
Architecture Diagram
Task Details
- Tạo EC2 Instance
- Tạo IAM Role và gắn cho EC2
- Cài đặt và cấu hình CloudWatch Agent
- Kiểm tra CloudWatch Metrics
- Kiểm tra CloudWatch Logs
1. Tạo EC2 Instance
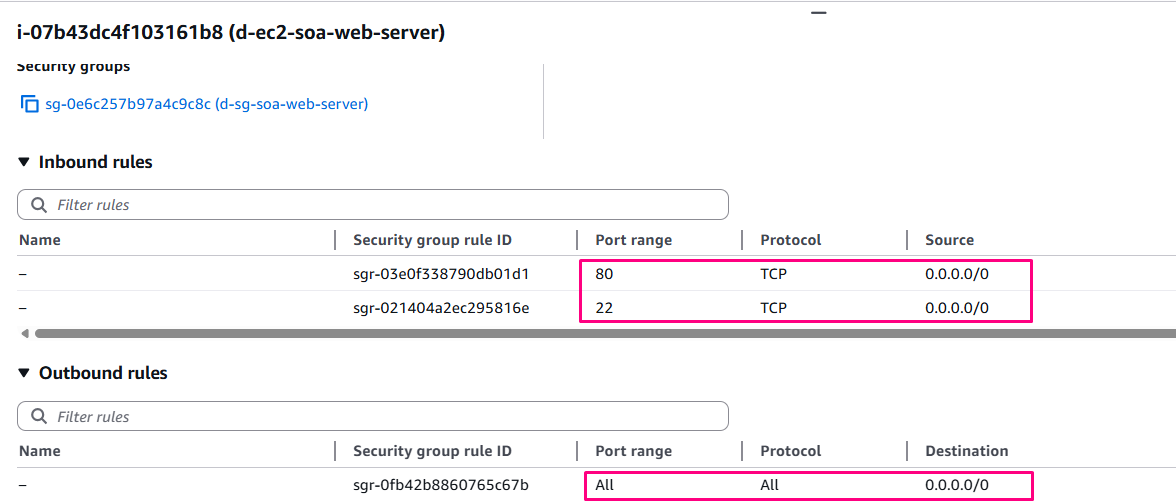
1.1 Create Web server Security Group
- Name:
d-sg-SOA-web-server - Description:
Allow http and ssh from Internet - VPC:
default VPC - Inbound rule and Outbound rule như hình
- Tag (Key:
Name, Value:d-sg-SOA-web-server)
1.2 Tạo EC2 Instance
- Name:
d-ec2-SOA-web-server - OS: Default (Amazon Linux 2023)
- Instance type: Default (t3.micro)
- Key pair: Create new keypair with name: d-key-SAA-common (Nếu có rồi thì ko cần tạo lại)
- Network Setting:
- VPC: Default
- Subnet:
us-east-1a - Auto-assign public IP:
Enable - Select existing security group:
d-sg-SOA-web-server
- Advanced details (User data)
#!/bin/bash
yum update -y
yum install -y httpd.x86_64
systemctl start httpd.service
systemctl enable httpd.service
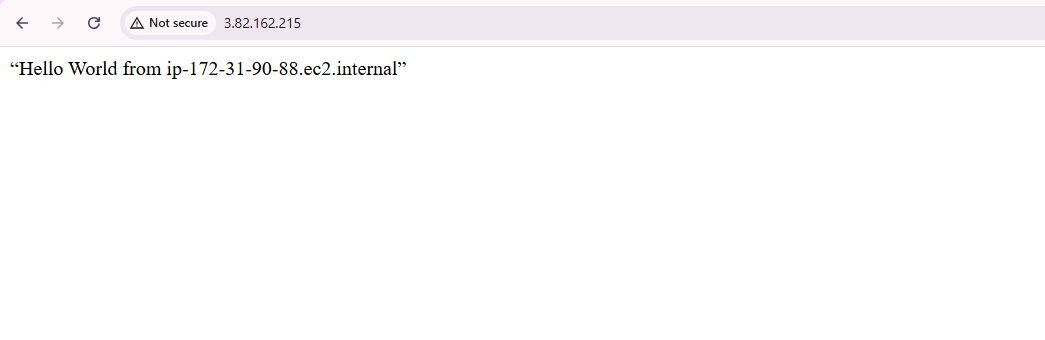
echo “Hello World from $(hostname -f)” > /var/www/html/index.html
Confirm Instance works: http://{public IP}
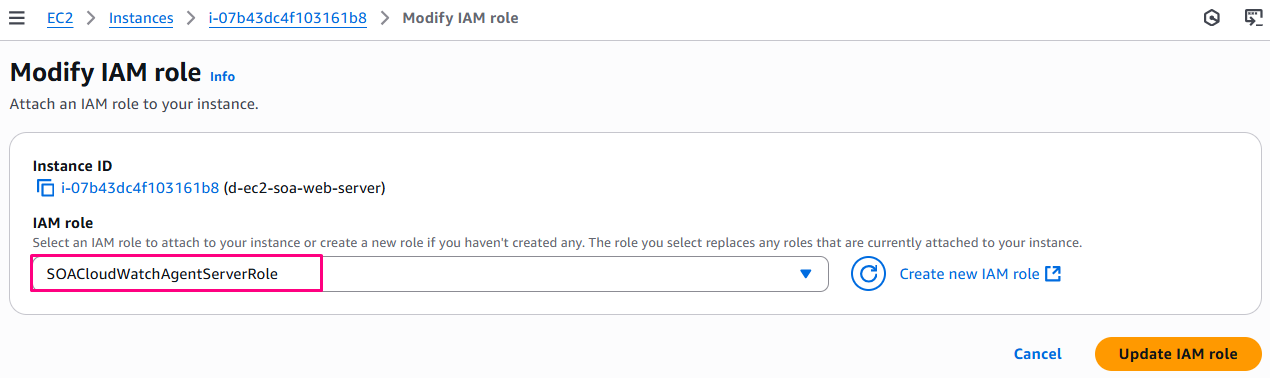
2. Tạo IAM Role và gắn cho EC2
- Use case:
EC2 - Permissions policies: (sử dụng AWS managed policy)
AmazonSSMManagedInstanceCoreCloudWatchAgentAdminPolicyCloudWatchAgentServerPolicy
- Role name:
SOACloudWatchAgentServerRole
Sau khi Create Role xong thì gắn vào EC2 đã tạo phía trên
Mình sẽ giải thích vai trò của 3 Policy này:
1. AmazonSSMManagedInstanceCore
Vai trò:
- Cho phép EC2 instance kết nối với AWS Systems Manager (SSM)
- Bắt buộc để EC2 có thể nhận commands từ SSM
Chức năng:
- Register EC2 như một managed instance trong SSM
- Cho phép sử dụng SSM Run Command
- Hỗ trợ Session Manager để connect vào EC2
- Cần thiết để deploy config từ Parameter Store
2. CloudWatchAgentAdminPolicy
Vai trò:
- Quyền quản trị CloudWatch Agent
- Cho phép đọc và ghi SSM Parameter Store
Chức năng:
- Tạo/Update CloudWatch Agent config trong Parameter Store
- Retrieve config từ Parameter Store
- Quản lý agent configuration centrally
- Bắt buộc khi sử dụng config wizard
3. CloudWatchAgentServerPolicy
Vai trò:
- Quyền runtime cho CloudWatch Agent
- Cho phép agent gửi metrics và logs đến CloudWatch
Chức năng:
- Push metrics đến CloudWatch Metrics
- Push logs đến CloudWatch Logs
- Đọc config từ Parameter Store (read-only)
- Quyền tối thiểu để agent hoạt động
3. Cài đặt và cấu hình CloudWatch Agent
SSH vào EC2 (Sử dụng EC2 Instance Connect hoặc SSH Client đều được)
Có nhiều cách để cài đặt CloudWatch Agent, Sau đây mình sẽ hướng dẫn cách cài đặt bằng command line
3.1 Cài CloudWatch Agent
sudo yum install amazon-cloudwatch-agent
Log sẽ trông như bên dưới
Loaded plugins: extras_suggestions, langpacks, priorities, update-motd
amzn2-core                                                                                                                                | 3.7 kB  00:00:00
Resolving Dependencies
--> Running transaction check
---> Package amazon-cloudwatch-agent.x86_64 0:1.247350.0-1.amzn2 will be installed
--> Finished Dependency Resolution

Dependencies Resolved

=================================================================================================================================================================
 Package                                        Arch                          Version                                    Repository                         Size
=================================================================================================================================================================
Installing:
 amazon-cloudwatch-agent                        x86_64                        1.247350.0-1.amzn2                         amzn2-core                         45 M

Transaction Summary
=================================================================================================================================================================
Install  1 Package

Total download size: 45 M
Installed size: 203 M
Is this ok [y/d/N]: y
Downloading packages:
amazon-cloudwatch-agent-1.247350.0-1.amzn2.x86_64.rpm                                                                                     |  45 MB  00:00:01
Running transaction check
Running transaction test
Transaction test succeeded
Running transaction
create group cwagent, result: 0
create user cwagent, result: 0
  Installing : amazon-cloudwatch-agent-1.247350.0-1.amzn2.x86_64                                                                                             1/1
  Verifying  : amazon-cloudwatch-agent-1.247350.0-1.amzn2.x86_64                                                                                             1/1

Installed:
  amazon-cloudwatch-agent.x86_64 0:1.247350.0-1.amzn2

Complete!
3.2 Cấu hình CloudWatch Agent
Sau khi cài đặt CloudWatch Agent, chúng ta cần cấu hình agent để có thể thu thập metrics và logs.
CloudWatch Agent sử dụng file cấu hình JSON bao gồm 3 sections chính:
agent: Cấu hình chung của agentmetrics: Định nghĩa các metrics cần thu thậplogs: Cấu hình các log files cần monitor
Các cách tạo file cấu hình:
Option 1: Sử dụng Wizard (Khuyến nghị cho người mới)
- Wizard sẽ hướng dẫn step-by-step
- Tự động tạo file cấu hình với default values được tối ưu
- Phù hợp cho việc setup lần đầu
Option 2: Tạo file JSON manually
- Tự tạo file JSON theo đúng specification
- Tái sử dụng file cấu hình có sẵn
- Phù hợp khi đã có kinh nghiệm hoặc cần custom chi tiết
Chạy Configuration Wizard:
Để sử dụng wizard tạo file cấu hình, chạy lệnh sau:
sudo /opt/aws/amazon-cloudwatch-agent/bin/amazon-cloudwatch-agent-config-wizard
Làm theo hướng dẫn sau:
- ✅ => lựa chọn
- 📥 Enter => theo default
- (⌨️ INPUT) => chổ cần nhập tay
[ec2-user@ip-172-31-90-88 ~]$ sudo /opt/aws/amazon-cloudwatch-agent/bin/amazon-cloudwatch-agent-config-wizard
================================================================
= Welcome to the Amazon CloudWatch Agent Configuration Manager =
=                                                              =
= CloudWatch Agent allows you to collect metrics and logs from =
= your host and send them to CloudWatch. Additional CloudWatch =
= charges may apply.                                           =
================================================================
On which OS are you planning to use the agent?
1. linux ✅
2. windows
3. darwin
default choice: [1]:
1
Trying to fetch the default region based on ec2 metadata...
I! imds retry client will retry 1 timesAre you using EC2 or On-Premises hosts?
1. EC2 ✅
2. On-Premises
default choice: [1]:
1
Which user are you planning to run the agent?
1. cwagent
2. root ✅
3. others
default choice: [1]:
2
Do you want to turn on StatsD daemon?
1. yes ✅
2. no
default choice: [1]:
1
Which port do you want StatsD daemon to listen to?
default choice: [8125] 📥 Enter

What is the collect interval for StatsD daemon?
1. 10s ✅
2. 30s
3. 60s
default choice: [1]:
1
What is the aggregation interval for metrics collected by StatsD daemon?
1. Do not aggregate
2. 10s
3. 30s
4. 60s ✅
default choice: [4]:
4
Do you want to monitor metrics from CollectD? WARNING: CollectD must be installed or the Agent will fail to start
1. yes
2. no ✅
default choice: [1]:
2
Do you want to monitor any host metrics? e.g. CPU, memory, etc.
1. yes ✅
2. no
default choice: [1]:
1
Do you want to monitor cpu metrics per core?
1. yes ✅
2. no
default choice: [1]:
1
Do you want to add ec2 dimensions (ImageId, InstanceId, InstanceType, AutoScalingGroupName) into all of your metrics if the info is available?
1. yes ✅
2. no
default choice: [1]:
1
Do you want to aggregate ec2 dimensions (InstanceId)?
1. yes ✅
2. no
default choice: [1]:
1
Would you like to collect your metrics at high resolution (sub-minute resolution)? This enables sub-minute resolution for all metrics, but you can customize for specific metrics in the output json file.
1. 1s
2. 10s
3. 30s
4. 60s ✅
default choice: [4]:
4
Which default metrics config do you want?
1. Basic
2. Standard ✅
3. Advanced
4. None
default choice: [1]:
2
Current config as follows:
{
        "agent": {
                "metrics_collection_interval": 60,
                "run_as_user": "root"
        },
        "metrics": {
                "aggregation_dimensions": [
                        [
                                "InstanceId"
                        ]
                ],
                "append_dimensions": {
                        "AutoScalingGroupName": "${aws:AutoScalingGroupName}",
                        "ImageId": "${aws:ImageId}",
                        "InstanceId": "${aws:InstanceId}",
                        "InstanceType": "${aws:InstanceType}"
                },
                "metrics_collected": {
                        "cpu": {
                                "measurement": [
                                        "cpu_usage_idle",
                                        "cpu_usage_iowait",
                                        "cpu_usage_user",
                                        "cpu_usage_system"
                                ],
                                "metrics_collection_interval": 60,
                                "resources": [
                                        "*"
                                ],
                                "totalcpu": false
                        },
                        "disk": {
                                "measurement": [
                                        "used_percent",
                                        "inodes_free"
                                ],
                                "metrics_collection_interval": 60,
                                "resources": [
                                        "*"
                                ]
                        },
                        "diskio": {
                                "measurement": [
                                        "io_time"
                                ],
                                "metrics_collection_interval": 60,
                                "resources": [
                                        "*"
                                ]
                        },
                        "mem": {
                                "measurement": [
                                        "mem_used_percent"
                                ],
                                "metrics_collection_interval": 60
                        },
                        "statsd": {
                                "metrics_aggregation_interval": 60,
                                "metrics_collection_interval": 10,
                                "service_address": ":8125"
                        },
                        "swap": {
                                "measurement": [
                                        "swap_used_percent"
                                ],
                                "metrics_collection_interval": 60
                        }
                }
        }
}
Are you satisfied with the above config? Note: it can be manually customized after the wizard completes to add additional items.
1. yes ✅
2. no
default choice: [1]:
1
Do you have any existing CloudWatch Log Agent (http://docs.aws.amazon.com/AmazonCloudWatch/latest/logs/AgentReference.html) configuration file to import for migration?
1. yes
2. no ✅
default choice: [2]:
2
Do you want to monitor any log files?
1. yes ✅
2. no
default choice: [1]:
1
Log file path: (⌨️ INPUT)
/var/log/httpd/access_log
Log group name:
default choice: [access_log] 📥 Enter

Log group class:
1. STANDARD ✅
2. INFREQUENT_ACCESS
default choice: [1]:
1
Log stream name:
default choice: [{instance_id}] 📥 Enter

Log Group Retention in days
1. -1
2. 1
3. 3
4. 5
5. 7 ✅
6. 14
7. 30
8. 60
9. 90
10. 120
11. 150
12. 180
13. 365
14. 400
15. 545
16. 731
17. 1096
18. 1827
19. 2192
20. 2557
21. 2922
22. 3288
23. 3653
default choice: [1]:
5
Do you want to specify any additional log files to monitor?
1. yes ✅
2. no
default choice: [1]:
1
Log file path:  (⌨️ INPUT)
/var/log/httpd/error_log
Log group name:
default choice: [error_log] 📥 Enter

Log group class:
1. STANDARD ✅
2. INFREQUENT_ACCESS
default choice: [1]:
1
Log stream name:
default choice: [{instance_id}] 📥 Enter

Log Group Retention in days
1. -1
2. 1
3. 3
4. 5
5. 7 ✅
6. 14
7. 30
8. 60
9. 90
10. 120
11. 150
12. 180
13. 365
14. 400
15. 545
16. 731
17. 1096
18. 1827
19. 2192
20. 2557
21. 2922
22. 3288
23. 3653
default choice: [1]:
5
Do you want to specify any additional log files to monitor?
1. yes
2. no ✅
default choice: [1]:
2
Do you want the CloudWatch agent to also retrieve X-ray traces?
1. yes
2. no ✅
default choice: [1]:
2
Existing config JSON identified and copied to:  /opt/aws/amazon-cloudwatch-agent/etc/backup-configs
Saved config file to /opt/aws/amazon-cloudwatch-agent/bin/config.json successfully.
Current config as follows:
{
        "agent": {
                "metrics_collection_interval": 60,
                "run_as_user": "root"
        },
        "logs": {
                "logs_collected": {
                        "files": {
                                "collect_list": [
                                        {
                                                "file_path": "/var/log/httpd/access_log",
                                                "log_group_class": "STANDARD",
                                                "log_group_name": "access_log",
                                                "log_stream_name": "{instance_id}",
                                                "retention_in_days": 7
                                        },
                                        {
                                                "file_path": "/var/log/httpd/error_log",
                                                "log_group_class": "STANDARD",
                                                "log_group_name": "error_log",
                                                "log_stream_name": "{instance_id}",
                                                "retention_in_days": 7
                                        }
                                ]
                        }
                }
        },
        "metrics": {
                "aggregation_dimensions": [
                        [
                                "InstanceId"
                        ]
                ],
                "append_dimensions": {
                        "AutoScalingGroupName": "${aws:AutoScalingGroupName}",
                        "ImageId": "${aws:ImageId}",
                        "InstanceId": "${aws:InstanceId}",
                        "InstanceType": "${aws:InstanceType}"
                },
                "metrics_collected": {
                        "cpu": {
                                "measurement": [
                                        "cpu_usage_idle",
                                        "cpu_usage_iowait",
                                        "cpu_usage_user",
                                        "cpu_usage_system"
                                ],
                                "metrics_collection_interval": 60,
                                "resources": [
                                        "*"
                                ],
                                "totalcpu": false
                        },
                        "disk": {
                                "measurement": [
                                        "used_percent",
                                        "inodes_free"
                                ],
                                "metrics_collection_interval": 60,
                                "resources": [
                                        "*"
                                ]
                        },
                        "diskio": {
                                "measurement": [
                                        "io_time"
                                ],
                                "metrics_collection_interval": 60,
                                "resources": [
                                        "*"
                                ]
                        },
                        "mem": {
                                "measurement": [
                                        "mem_used_percent"
                                ],
                                "metrics_collection_interval": 60
                        },
                        "statsd": {
                                "metrics_aggregation_interval": 60,
                                "metrics_collection_interval": 10,
                                "service_address": ":8125"
                        },
                        "swap": {
                                "measurement": [
                                        "swap_used_percent"
                                ],
                                "metrics_collection_interval": 60
                        }
                }
        }
}
Please check the above content of the config.
The config file is also located at /opt/aws/amazon-cloudwatch-agent/bin/config.json.
Edit it manually if needed.
Do you want to store the config in the SSM parameter store?
1. yes ✅
2. no
default choice: [1]:
1
What parameter store name do you want to use to store your config? (Use 'AmazonCloudWatch-' prefix if you use our managed AWS policy)
default choice: [AmazonCloudWatch-linux] 📥 Enter

Trying to fetch the default region based on ec2 metadata...
I! imds retry client will retry 1 timesWhich region do you want to store the config in the parameter store?
default choice: [us-east-1] 📥 Enter

Which AWS credential should be used to send json config to parameter store?
1. ASIAQ7HHTH2EWEVBAJ7X(From SDK) ✅
2. Other
default choice: [1]:

Successfully put config to parameter store AmazonCloudWatch-linux.
Program exits now.
[ec2-user@ip-172-31-90-88 ~]$
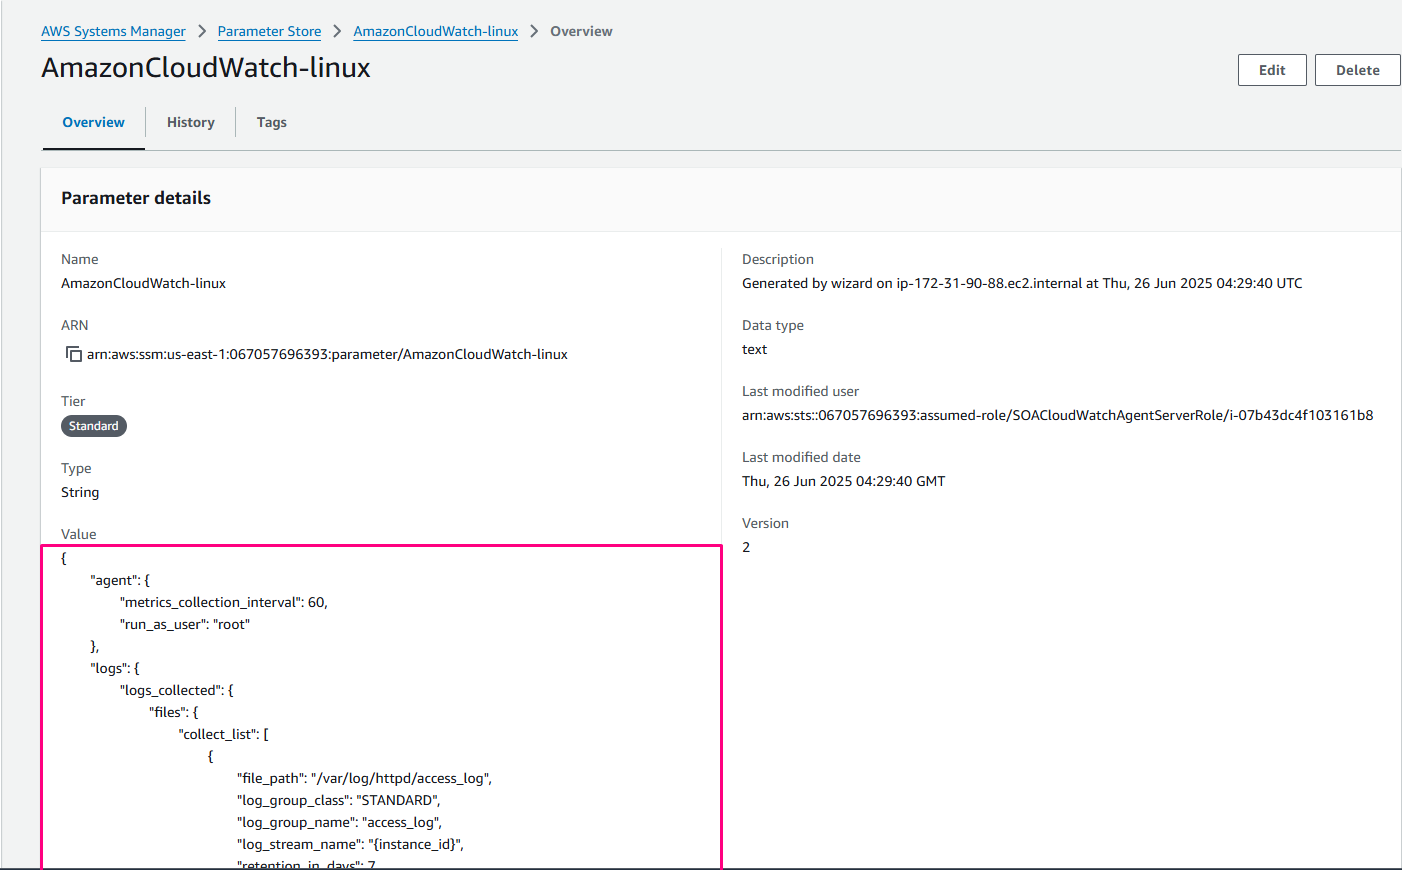
Sau khi thực hiện xong thì config chúng ta được lưu tại: /opt/aws/amazon-cloudwatch-agent/bin/config.json
Và cả trên SSM Parameter store
3.3 Khởi động CloudWatch Agent
Có 2 cách:
- Khởi động từ file json
sudo /opt/aws/amazon-cloudwatch-agent/bin/amazon-cloudwatch-agent-ctl -a fetch-config -m ec2 -s -c file:/opt/aws/amazon-cloudwatch-agent/bin/config.json
- Khởi động từ biến trên parameter store
sudo /opt/aws/amazon-cloudwatch-agent/bin/amazon-cloudwatch-agent-ctl -a fetch-config -m ec2 -s -c ssm:AmazonCloudWatch-linux
Log trông như bên dưới:
[ec2-user@ip-172-31-90-88 ~]$ sudo /opt/aws/amazon-cloudwatch-agent/bin/amazon-cloudwatch-agent-ctl -a fetch-config -m ec2 -s -c ssm:AmazonCloudWatch-linux
****** processing amazon-cloudwatch-agent ******
I! Trying to detect region from ec2 D! [EC2] Found active network interface I! imds retry client will retry 1 timesRegion: us-east-1 credsConfig: map[] Successfully fetched the config and saved in /opt/aws/amazon-cloudwatch-agent/etc/amazon-cloudwatch-agent.d/ssm_AmazonCloudWatch-linux.tmp
Start configuration validation...
2025/06/26 04:51:16 Reading json config file path: /opt/aws/amazon-cloudwatch-agent/etc/amazon-cloudwatch-agent.d/ssm_AmazonCloudWatch-linux.tmp ...
2025/06/26 04:51:16 I! Valid Json input schema.
2025/06/26 04:51:16 D! ec2tagger processor required because append_dimensions is set
2025/06/26 04:51:16 D! ec2tagger processor required because append_dimensions is set
2025/06/26 04:51:16 D! delta processor required because metrics with diskio or net are set
2025/06/26 04:51:16 D! ec2tagger processor required because append_dimensions is set
2025/06/26 04:51:16 Configuration validation first phase succeeded
I! Detecting run_as_user...
I! Trying to detect region from ec2
D! [EC2] Found active network interface
I! imds retry client will retry 1 times
/opt/aws/amazon-cloudwatch-agent/bin/amazon-cloudwatch-agent -schematest -config /opt/aws/amazon-cloudwatch-agent/etc/amazon-cloudwatch-agent.toml
Configuration validation second phase succeeded
Configuration validation succeeded
3.4 Check status CloudWatch Agent
sudo /opt/aws/amazon-cloudwatch-agent/bin/amazon-cloudwatch-agent-ctl -m ec2 -a status
Log trông như bên dưới:
[ec2-user@ip-172-31-90-88 ~]$ sudo /opt/aws/amazon-cloudwatch-agent/bin/amazon-cloudwatch-agent-ctl -m ec2 -a status
{
  "status": "running",
  "starttime": "2025-06-26T04:51:16+00:00",
  "configstatus": "configured",
  "version": "1.300054.1"
}
[ec2-user@ip-172-31-90-88 ~]$
4. Kiểm tra CloudWatch Metrics
Sau khi khởi động CloudWatch Agent, chúng ta cần xác nhận rằng các metrics đang được thu thập một cách bình thường.
Nếu việc thu thập metrics thành công, chúng ta có thể thấy "CWAgent" xuất hiện trong CloudWatch Metrics từ AWS Console.
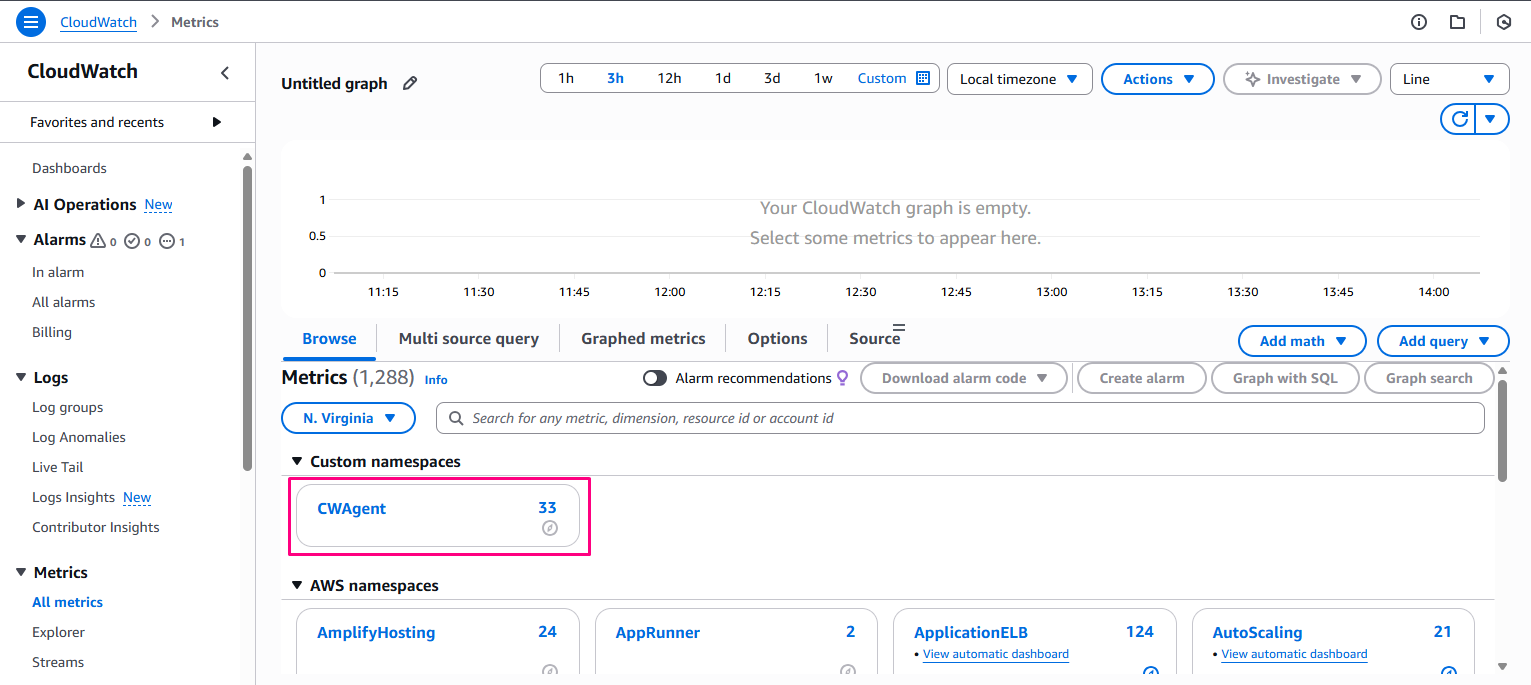
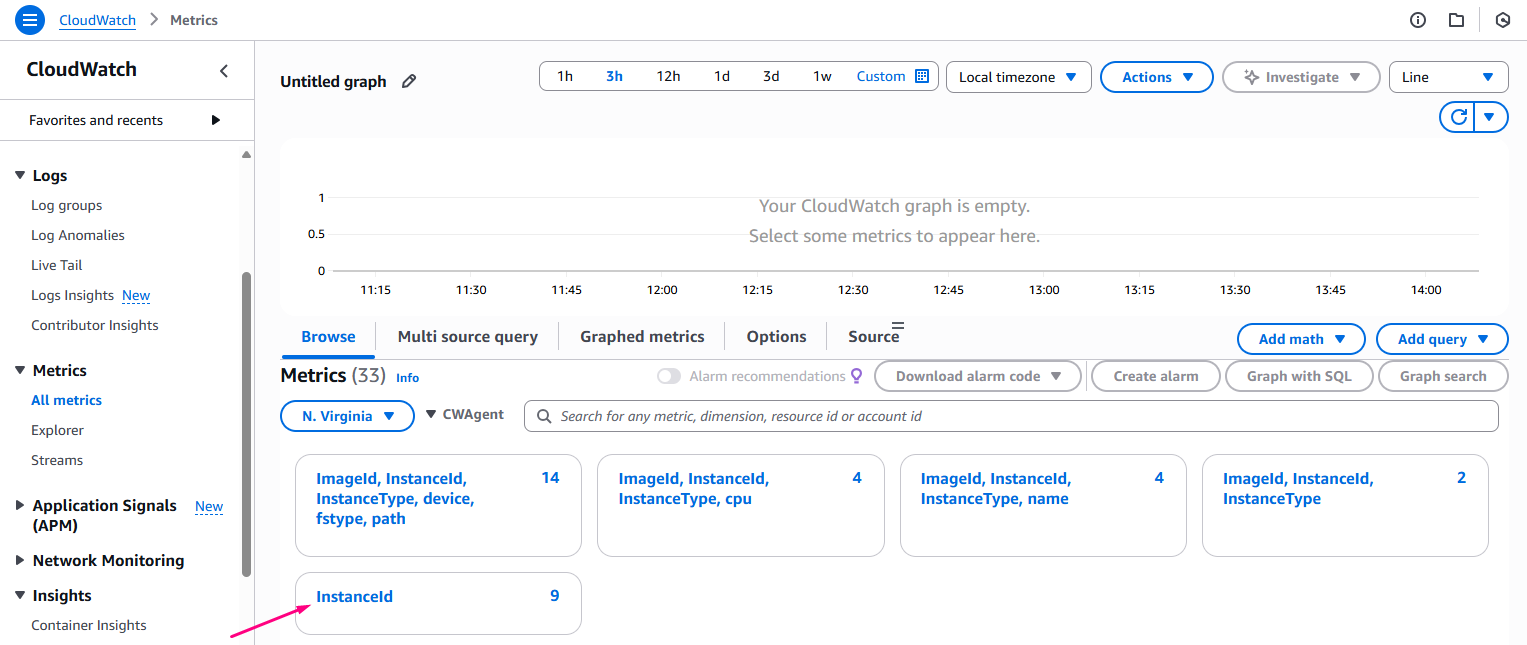
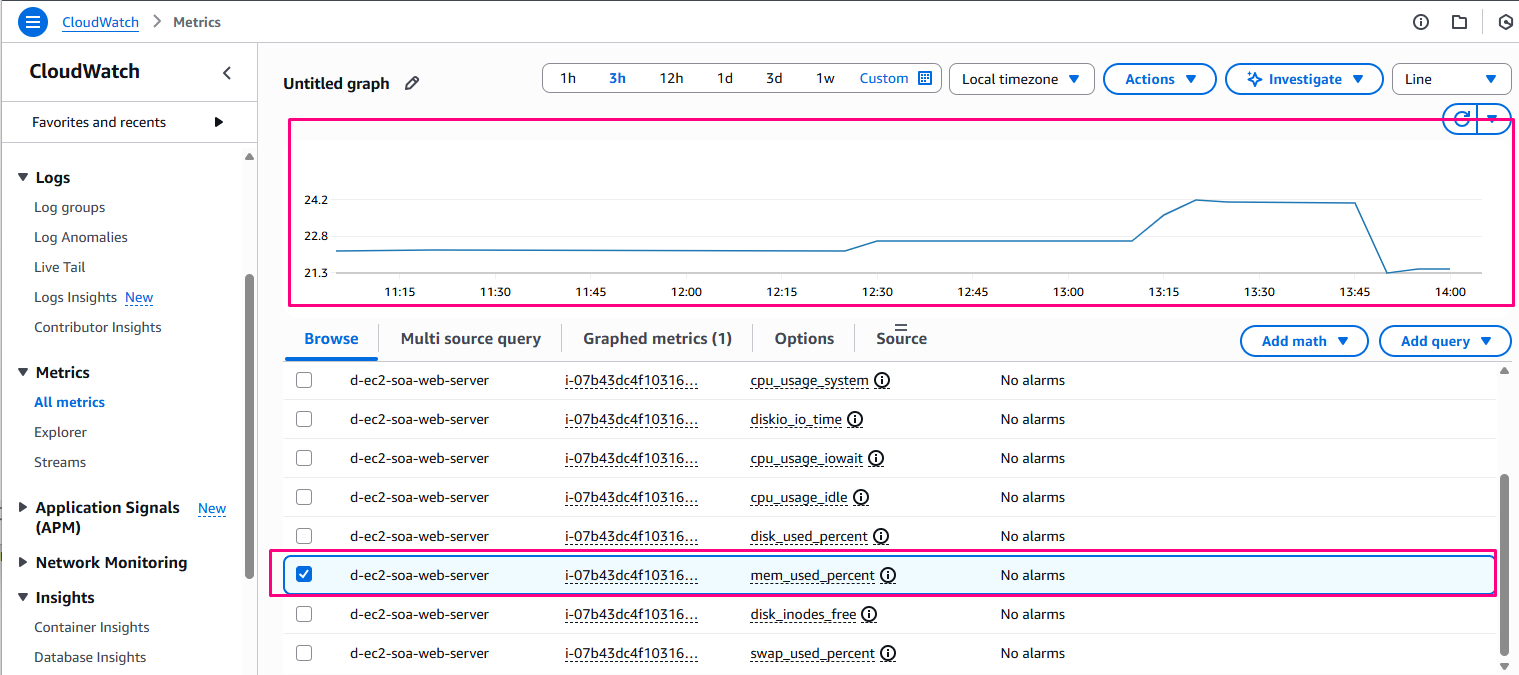
Các Metric custom được push lên từ Cloudwatch Agent đã hiển thị
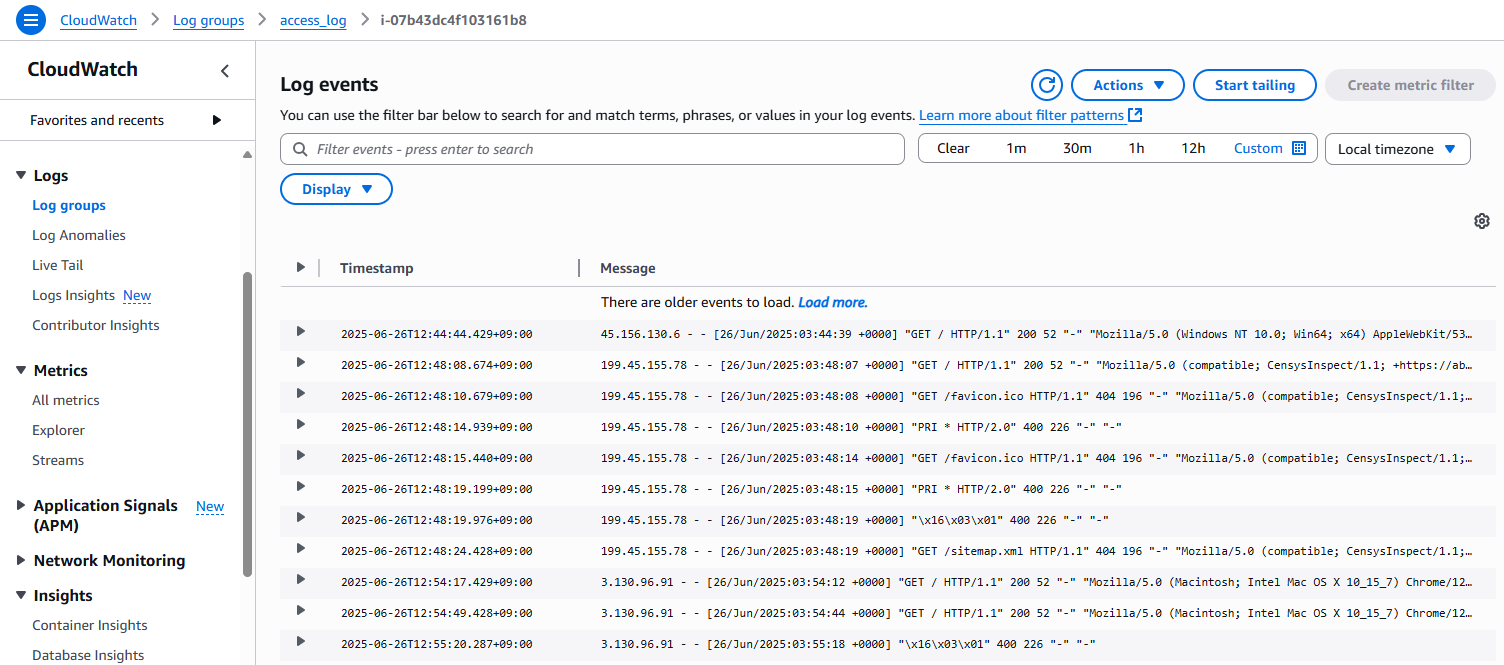
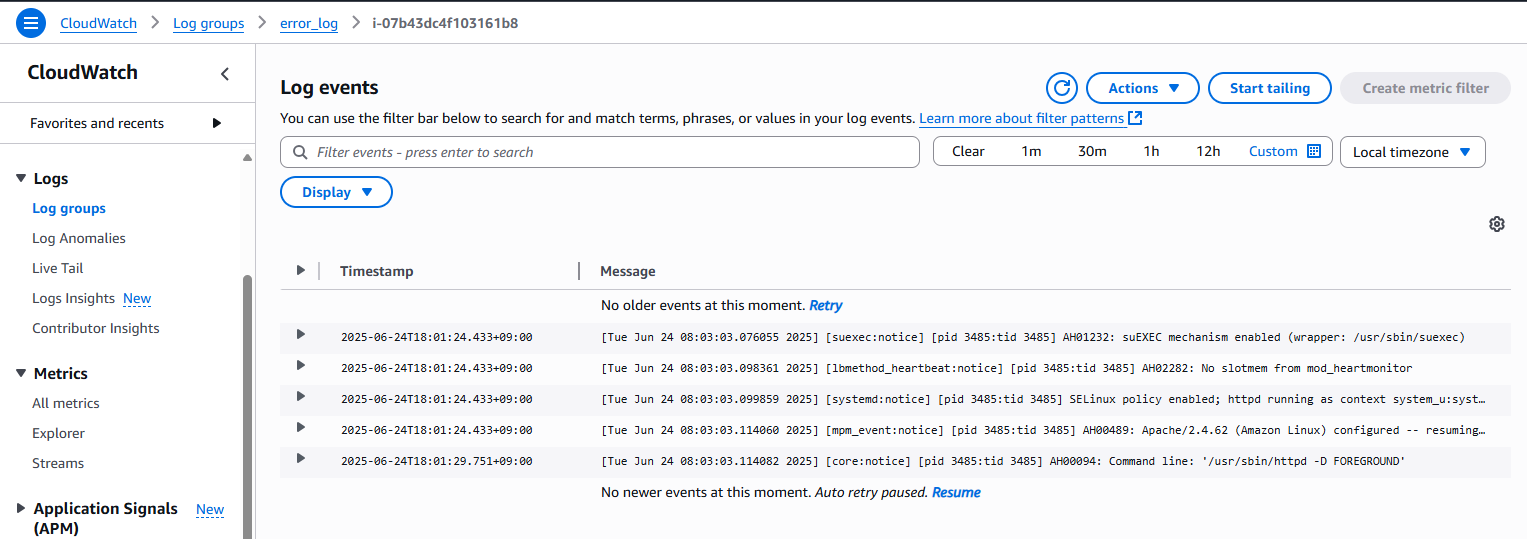
5. Kiểm tra CloudWatch Logs
Web server chúng ta đang chạy apache
- access_log:
/var/log/httpd/access_log - error_log:
/var/log/httpd/error_log
Nội dung trong 2 file log này cũng được gửi lên CloudWatch log
Challenge (Optional)
Update CloudWatch Agent config
Có 2 cách để update config (Khuyến khích cách thứ 2)
- update file /opt/aws/amazon-cloudwatch-agent/bin/config.json và sau đó push lên ssm parameter store
aws ssm put-parameter --name "AmazonCloudWatch-linux" --type "String" --value file:///opt/aws/amazon-cloudwatch-agent/bin/config.json --overwrite
- Update value biến
AmazonCloudWatch-linuxtrên Parameter store
Sau đó thì khởi động (fetch-config) để apply config mới. Cách khởi động thì như bước 3.3
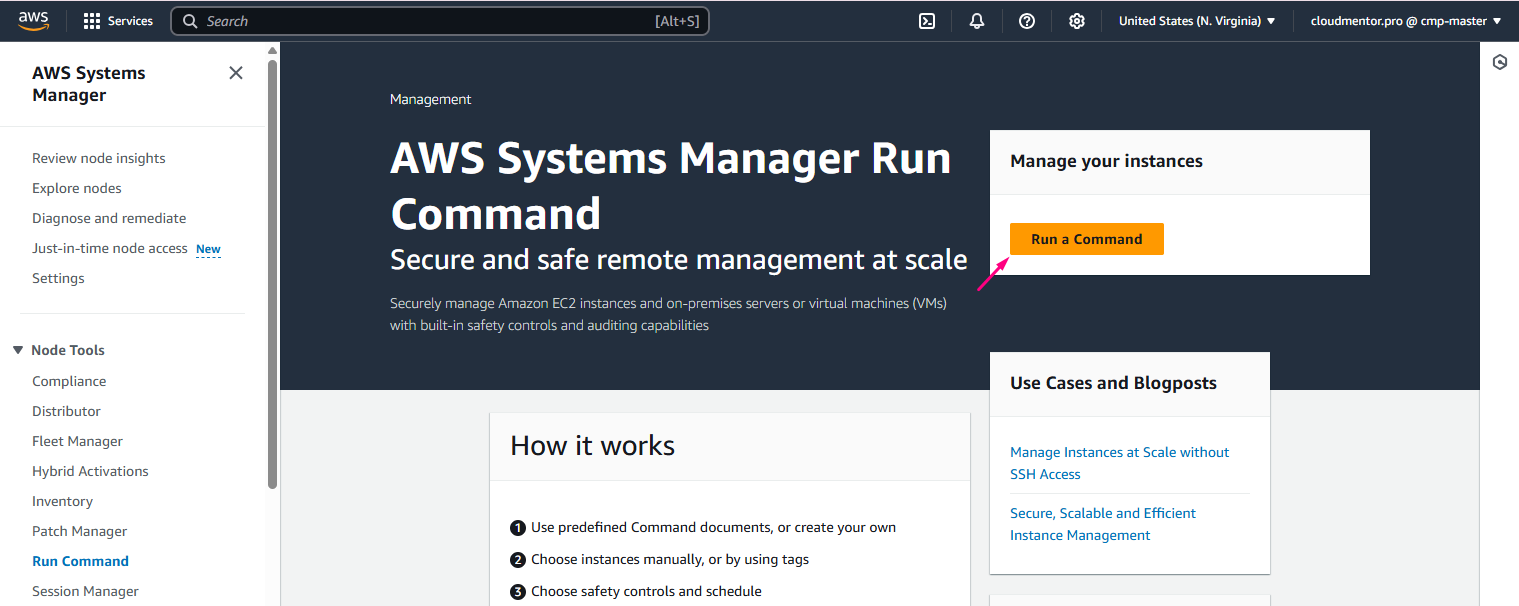
Deploy config đến multiple EC2 sử dụng Systems Manager Run Command
- Tạo EC2
d-ec2-soa-web-server-02và gắn Role như bước 1,2 phía trên - Cài CloudWatch Agent: Command line
sudo yum install amazon-cloudwatch-agenthoặc dùng SSM Feature Run Command
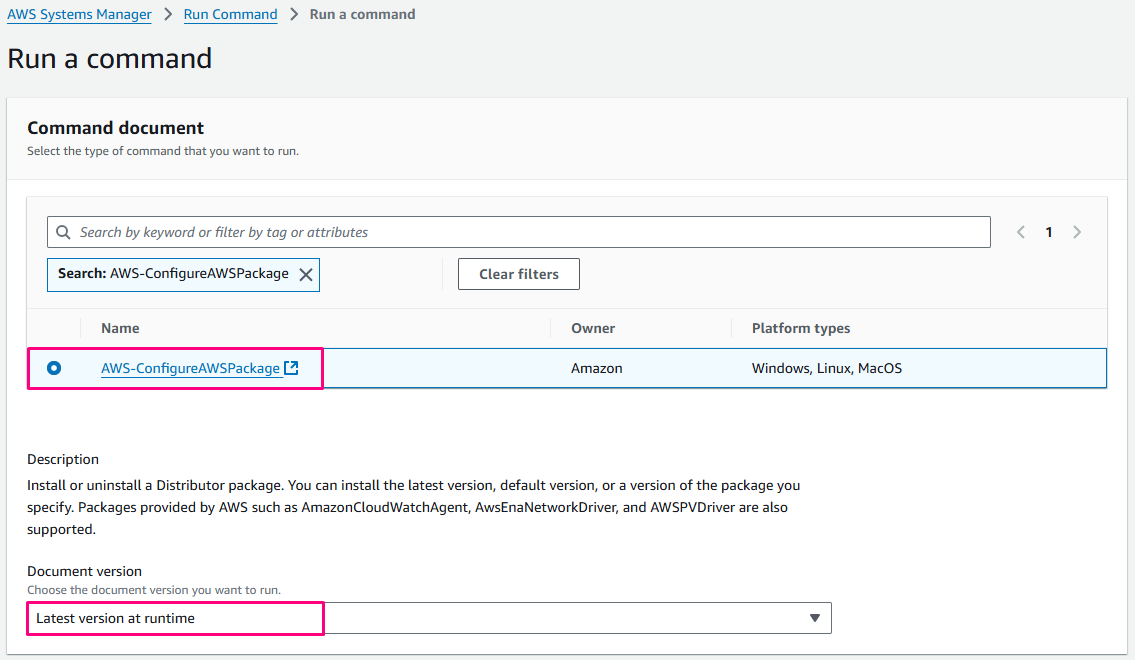
- Command document:
- Command document**:**
AWS-ConfigureAWSPackage - Document version:
Latest version at runtime
- Command document**:**
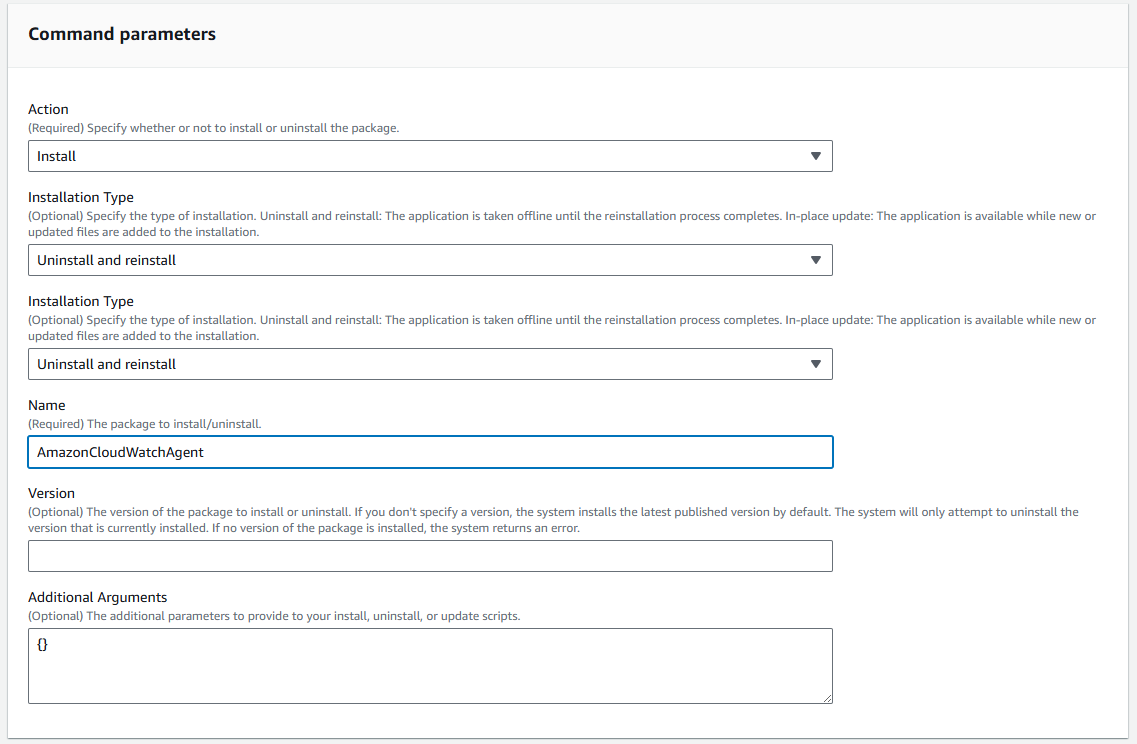
- Command parameters:
- Action:
install - installation Type:
Uninstall and reinstall - Installation Type:
Uninstall and reinstall - Name:
AmazonCloudWatchAgent - Version:
- Additional Arguments:{} ※Default
- Action:
- Target selection
- Instances:
d-ec2-soa-web-server-02
- Instances:
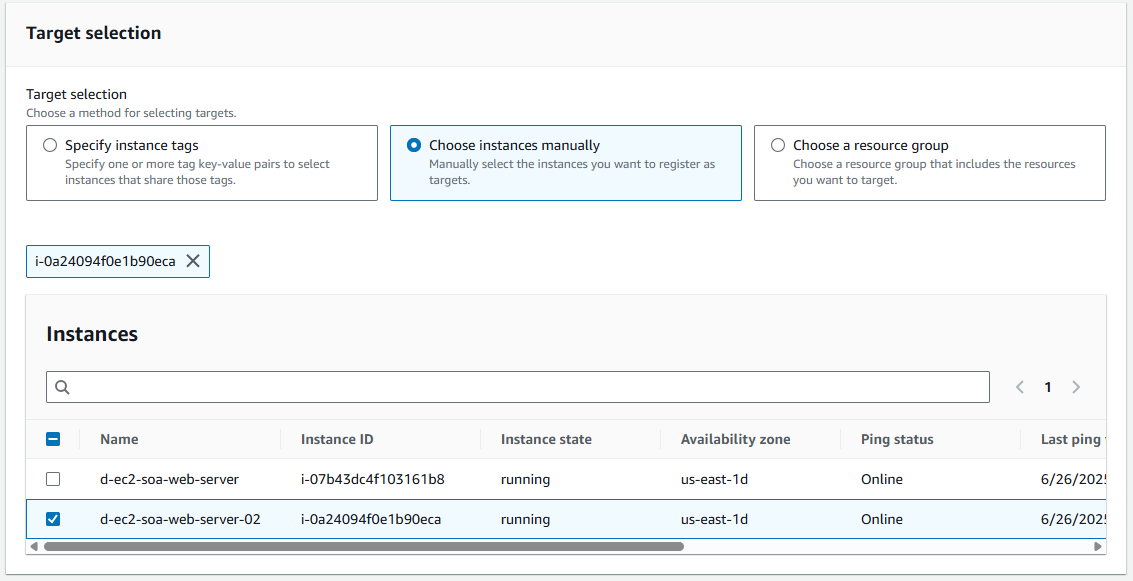
Các Option khác để Default và nhấn Run command
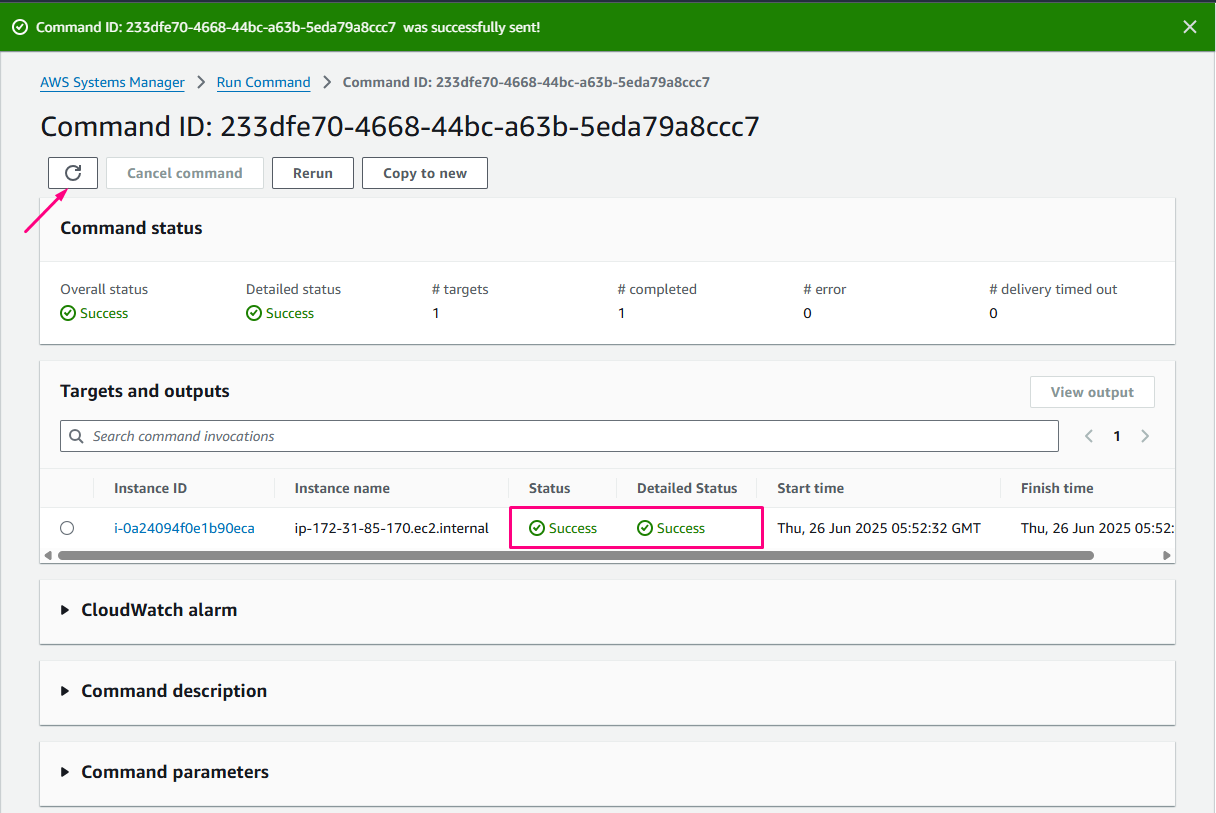
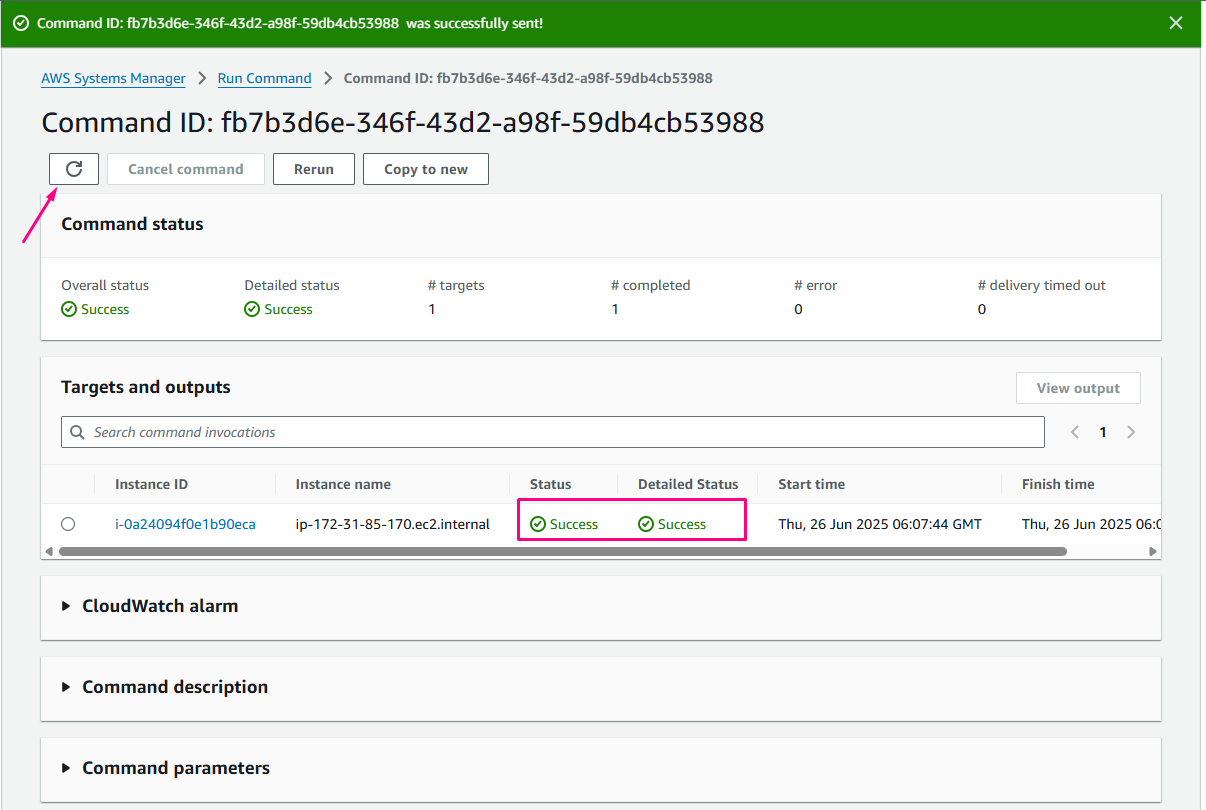
Reload để check command thực thi thành công chưa
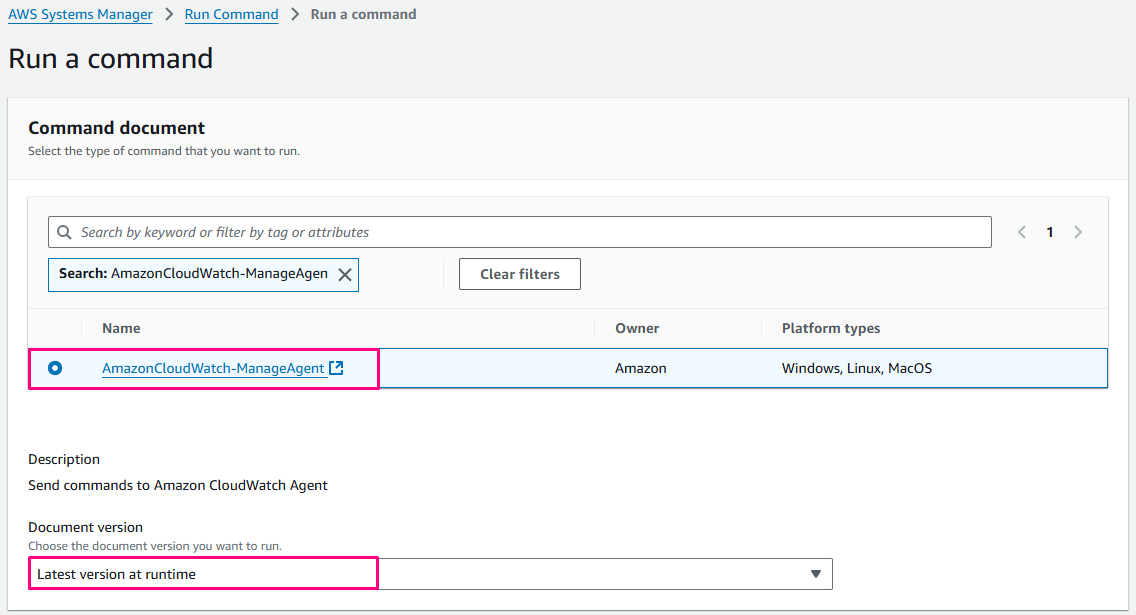
Sau khi cài đặt xong thì tiến hành khởi động Cloudwatch Agent (cũng sử dụng SSM Command)
- Command document:
- Command documen**:**
AmazonCloudWatch-ManageAgent - Document version:
Latest version at runtime
- Command documen**:**
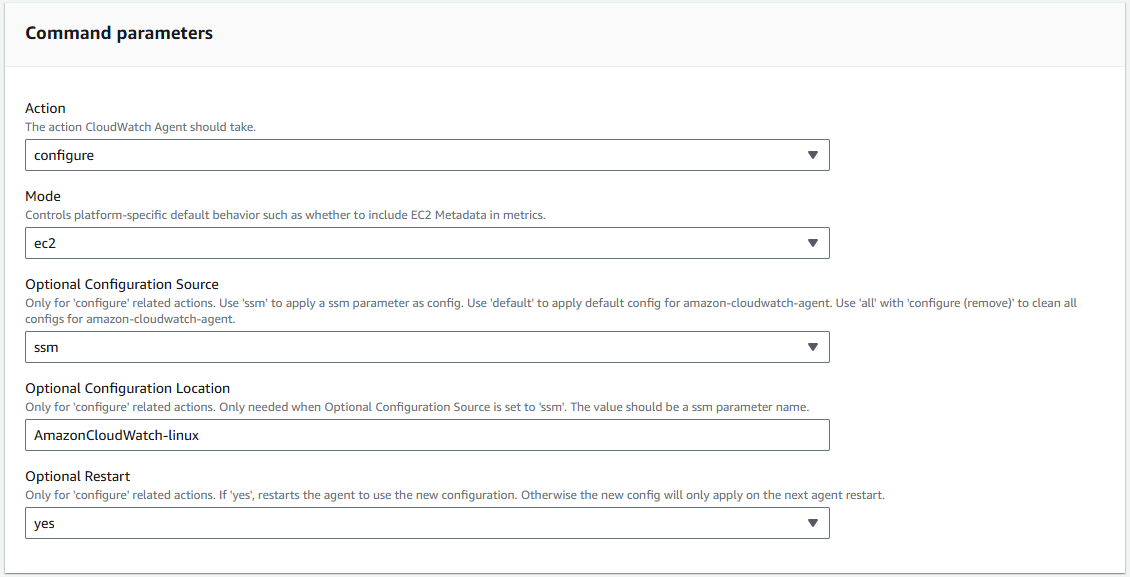
- Command parameters:
- Action:
configure - Mode:
ec2 - Optional Configuration Source:
ssm - Optional Configuration Location:
AmazonCloudWatch-linux - Optional Restart:
yes
- Action:
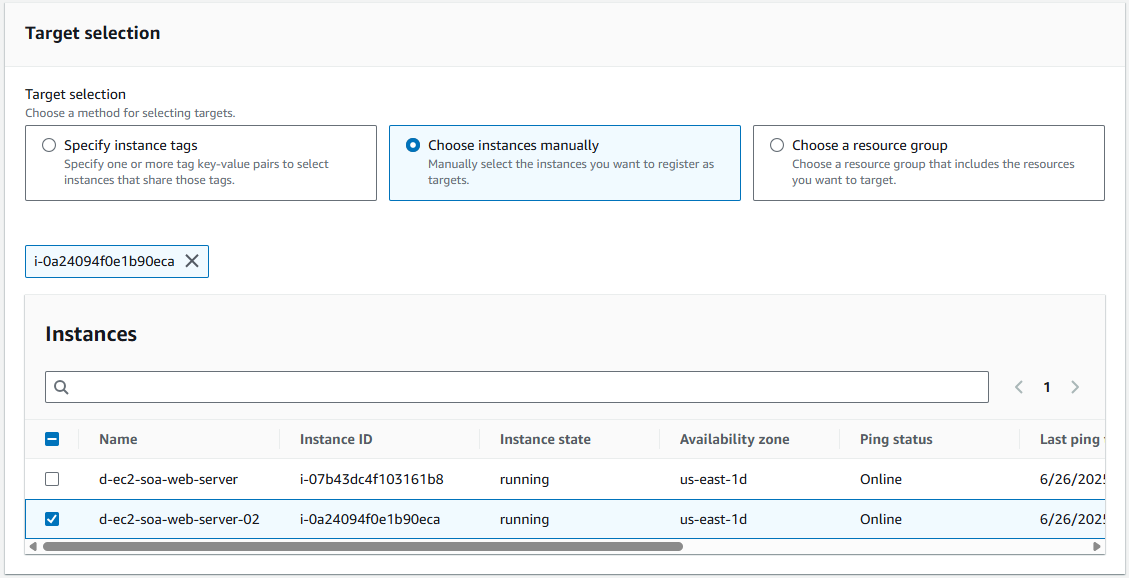
- Target selection
- Instances:
d-ec2-soa-web-server-02
- Instances:
Uncheck Enable an S3 bucket
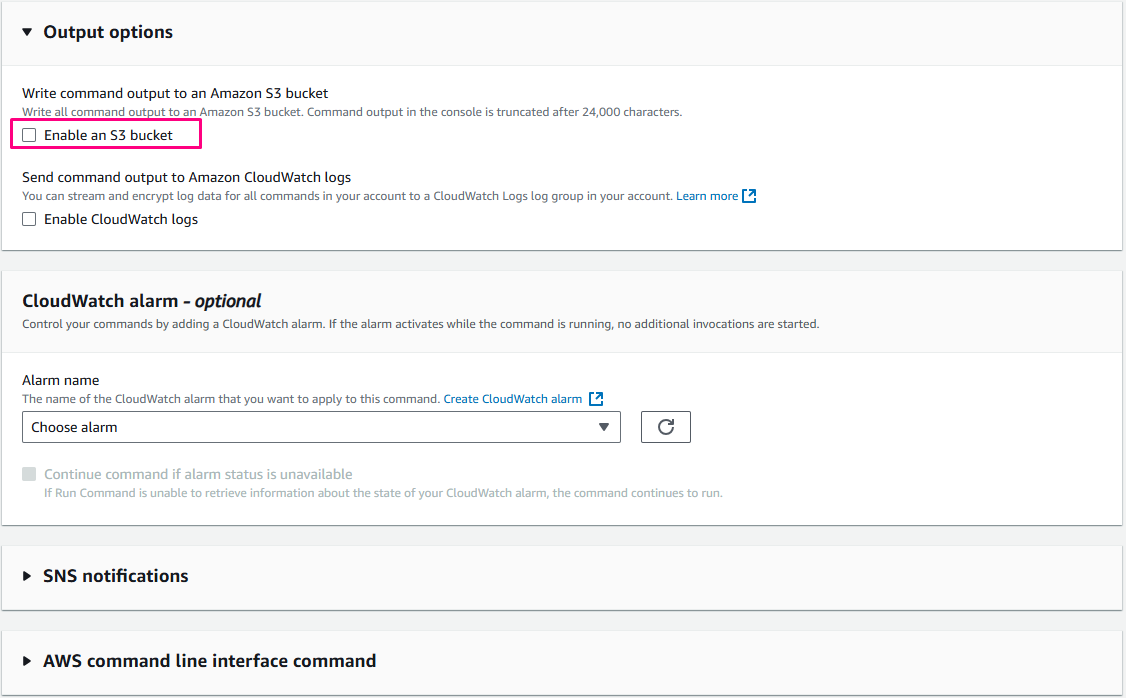
Các tùy chọn khác để default, nhấn Run
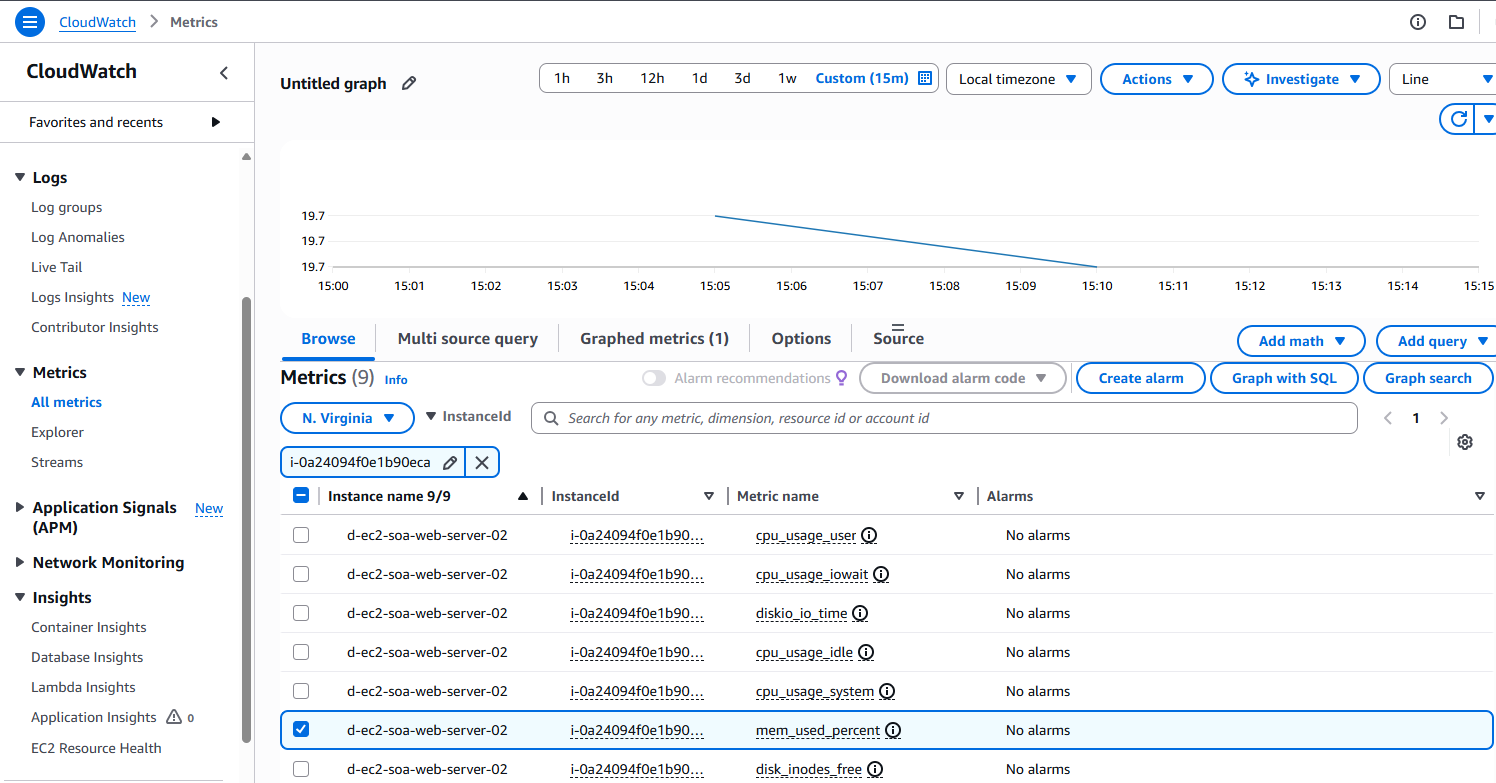
Đợi vài 5-10 (vì CloudWatch hiển thị metric chậm) phút chúng ta có thể thấy Metric được gửi đến CloudWatch từ EC2 d-ec2-soa-web-server-02
Tạo CloudWatch Alarms dựa trên custom metrics
- Cái này cũng tương tự như cách tạo Alarm trên các Metric default như CPU vv đã được học ở SAA hoặc DVA bài Monitoring
Troubleshooting
- Trường hợp không store được config vào Parameter store
- Kiểm tra EC2 đã được gắn Role tương ứng chưa
- Kiểm tra Role đã được gắn đúng 3 Policy chưa
- Trường hợp 5-10 phút mà vẫn chưa thấy log đến CloudWatch log
- Access đến Ip public của EC2 để có access log
- Trường hợp không thấy Metric memory được hiển thị trên console
- Kiểm tra Agent đang running không:
sudo /opt/aws/amazon-cloudwatch-agent/bin/amazon-cloudwatch-agent-ctl -m ec2 -a status
- Kiểm tra Agent đang running không:
Clean up resources
- Terminated các EC2
- Xóa Security group tương ứng
- Delete Parameter Store:
AmazonCloudWatch-linux - Delete Role:
SOACloudWatchAgentServerRole