Lab Introduction
- AWS experience: Intermediate
- Time to complete: 90 minutes
- AWS Region: US East (N. Virginia) us-east-1
- Cost to complete: (Optional) Free Tier eligible
- Services used: Amazon Bedrock, AWS OpenSearch Serverless, Lambda, DynamoDB, Amazon S3.
A. Knowledge Bases and RAG (thực hành làm quen triển khai RAG trên AWS Console)
Introduction to Knowledge Bases for Amazon Bedrock
- Knowledge Bases cho Amazon Bedrock cho phép cung cấp thông tin ngữ cảnh từ dữ liệu nội bộ của công ty để các mô hình ngôn ngữ (Foundation Models - FMs) và agents trả lời câu hỏi chính xác, phù hợp hơn.

- Dữ liệu sẽ được xử lý qua các bước sau:
- Nguồn dữ liệu: lấy từ Amazon S3 hoặc các nguồn dữ liệu khác.
- Phân chia tài liệu (Document chunks): Dữ liệu được chia thành các phần nhỏ.
- Embeddings model: sử dụng Amazon Titan Embeddings để chuyển đổi các đoạn dữ liệu này thành dạng vector embedding.
- Vector store: các embeddings này được lưu vào cơ sở dữ liệu vector như Amazon OpenSearch Service Serverless (AOSS).
- Amazon Bedrock hỗ trợ toàn bộ quy trình từ nhập liệu, xử lý, lưu trữ và cập nhật embeddings.
- Người dùng truy vấn dữ liệu thông qua API "RetrieveAndGenerate" để lấy kết quả liên quan và dùng các dữ liệu này làm ngữ cảnh để mô hình ngôn ngữ (LLM) tạo ra câu trả lời chính xác hơn.
Lưu ý trước khi thực hành:
- Sử dụng IAM với quyền Adminstrator, không dùng Root account trong bài thực hành.
- Sử dụng region US để không bị giới hạn Foundation model trong tài khoản.
1.1 Create a vector store - OpenSearch Serverless index
- Go to Amazon Opensearch Service
- In the lefthand section, go to Serverless and click Dashboard

- Click on Get Started

- Give the collection name bedrock-sample-rag and in collection type select Vector Search , under Deployment type ensure Enable redundancy is selected and Security Easy create is selected. Click Next

- On Review and create collection Click Submit

- Wait for the collection to complete and then select the *index section.
- Click on Create vector index

- Select JSON option and then give the Vector index name as bedrock-sample-rag-index and paste the following json code and click create
{
   "settings": {
      "index.knn": "true",
       "number_of_shards": 1,
       "knn.algo_param.ef_search": 512,
       "number_of_replicas": 0
   },
   "mappings": {
      "properties": {
         "vector": {
            "type": "knn_vector",
            "dimension": 1536,
             "method": {
                 "name": "hnsw",
                 "engine": "faiss",
                 "space_type": "l2"
             }
         },
         "text": {
            "type": "text"
         },
         "text-metadata": {
            "type": "text"
         }
      }
   }
}

- Save the following properties this will be used when knowledge base will be created in Bedrock
- index name: bedrock-sample-rag-index
- Vector field name: vector
- Metadata: text & text-metadata

- Save the arn name of collection this will be later used in knowledge base creation

1.2 Upload Data into S3 & Request Access Foundation Model
Chúng ta sử dụng 4 file pdf từ Amazon, tượng chưng cho tài liệu nội bộ, hỏi đáp chatbot các thông tin từ trong tài liệu này.
- Download the following files to your local directory,AMZN-2021-Shareholder-Letter , AMZN-2019-Shareholder-Letter , AMZN-2020-Shareholder-Letter , AMZN-2022-Shareholder-Letter
- Create new S3 bucket with name: aws-bedrock-kb-workshop-aoss.
- Next, upload these files to a bucket in S3 , in this case the bucket name is aws-bedrock-kb-workshop-aoss, it is advised to choose a unique bucket name and remember it during knowledge base creation

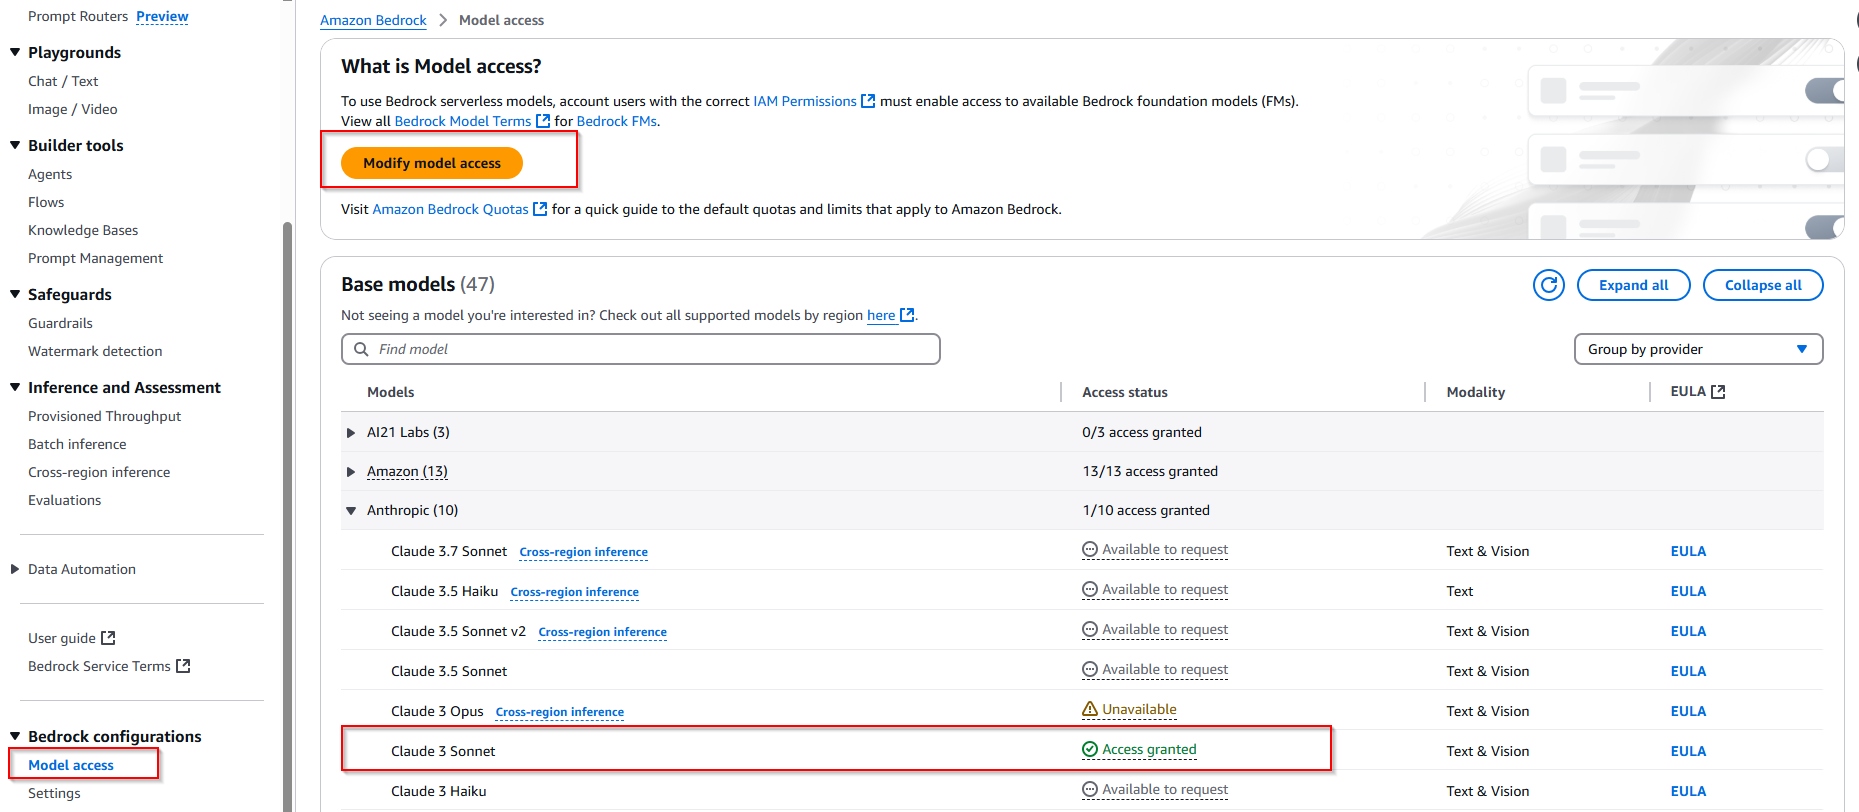
- Request access foundation model of Amazon
- In this lab, we will use the Titan Embeddings G1 - Text model as the Embeddings model.
- After the request is successful, the status Access granted will be displayed.
Access Bedrock service -> Choose Model Access -> Choose button Modify model -> Check all model AWS -> Choose button Submit.

1.3 Creating knowledge base
- Go to Bedrock Console
- Go to Builder tools and select Knowledge Bases

- Click Create and select Knowledge Base with vectore store

- Make sure in IAM Permissions section Create and use a new service role is selected and in Choose data source section Amazon S3 is selected, click Next

- In the S3 URI Browse S3 and select the bucket in which the reports are uploaded from Section 1.2, Step b and in chunking strategy change to Fixed-size chunking and Max tokens to 512 and click Next

- In Embeddings Model Section click Select Model

- Select Titan Embeddings G1-Text V1.2 and click *Apply
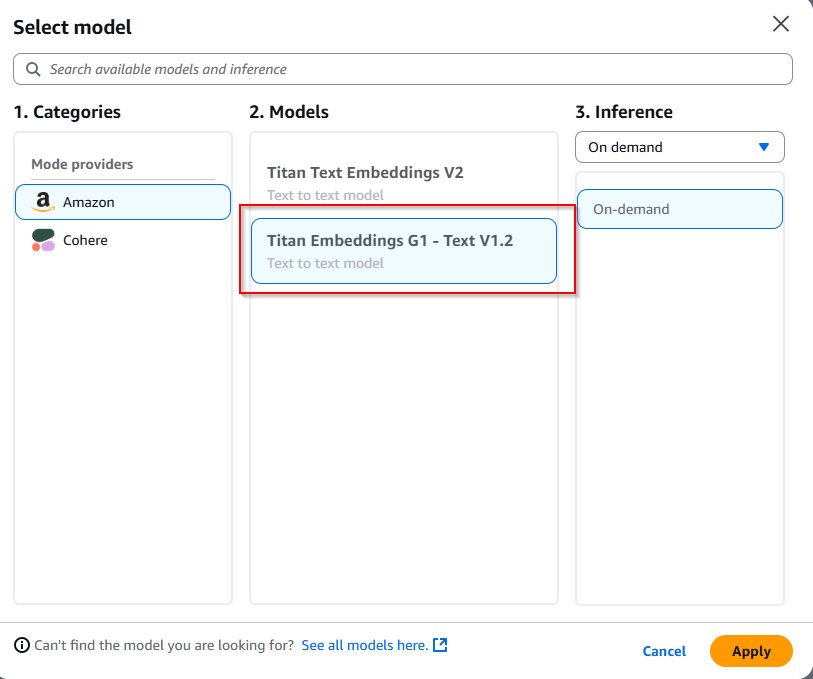
- In Vector Database section click Choose a vector store you have created and make sure Vector engine for Amazon OpenSearch is selected

- Scroll below to add the properties. In Collection ARN, enter the ARN from Section 1.1, Step j, in Vector index name enter bedrock-sample-rag-index from Section 1.1, Step i, similarly add Vector field name as vector. In Metadata field mapping enter Text field name as text and Bedrock-managed metadata field name as text-metadata. Click Next

- In Review and create section click Create Knowledge Base

- Once the Knowledge base is created go to Data Source select the data source and click on sync

1.4 Test the Knowlege Base
- In Test Knowledge Base click on Select Model

- Select Anthropic and then select Claude 3.5 Haiku and click Apply

- Enter the following question to use the Retreieve and Generate API and click Run
What is Amazon doing in the field of generative AI?

- Click on Show Details of generated answer to check the chunks of data extracted from Knowledge base to answer the question. In Source details, the chunks and the metadata associated from chunks can be seen

- Congratulations on successfully creating a knowledge base from a vector store.
B. Creating an AI agent with code interpretation capabilities using the Amazon Bedrock console (thực hành làm quen với AI agent thông qua AWS Console)
Trong phần B này, chúng ta sẽ tạo một Agent chuyên về phân tích và trực quan hóa dữ liệu. Có thể viết, chạy và gỡ lỗi code Python. Giải thích các câu hỏi liên quan về phân tích dữ liệu từ người dùng.
1. Access Amazon Bedrock Console
- Sign in to the AWS Management Console
- Navigate to the Amazon Bedrock service
- Select "Agents" from the left navigation pane

2. Create a new Agents
- Click on "Create Agent"
- Provide a name for your agent "DataAnalysisAssistant"
- Add a description (Optional) - "AI Agent with Code Interpreter enabled for Data analysis"
- Click "Create"

- In the Agent builder, go to the "Agent details" section
- For "Agent resource role", select "Create and use a new service role"
- Choose a foundation model optimized for agents (e.g., Claude 3.5 Sonnet v2)
- In "Instructions for the Agent", enter:
You are an AI assistant specialized in data analysis and visualization. You can write, run, and debug Python code to help users with their queries. Always provide clear explanations of your process and results.

Note: "Instructions for the Agent" là phần quan trọng nhất, nơi hướng dẫn hoặc chỉ dẫn dành cho hệ thống hoặc ứng dụng AI (được gọi là "Agent") để thực hiện nhiệm vụ cụ thể.
4. Enable Code Interpreter
- Expand "Additional settings"
- Find "Code Interpreter" and toggle it on
- In the same "Additional settings" section, ensure "User input" is enabled
- Code Interpreter (Trình biên dịch code): Cho phép Agents chạy, kiểm tra, hoặc sửa code trực tiếp trong môi trường Bedrocks.
- User Input: Cho phép agent hỏi thêm thông tin từ người dùng khi dữ liệu đầu vào ban đầu chưa đủ rõ ràng.

6. Review and Save Agent Configuration
- Review all settings to ensure they're correct
- Click "Save" to apply your configurations

7. Prepare the Agent
- After saving, click on "Prepare" to make the agent ready for testing
- Wait for the preparation process to complete

8. Test the Agent
- Once prepared, use the test window (on the right side panel) to interact with your agent
- Try the following prompt to test the code interpreter:
Using the customer satisfaction data provided below, create a bar graph showing the average overall rating for each hotel (H001, H002, H003). The graph should have the hotel IDs on the x-axis and the average overall rating on the y-axis.

date,hotel_id,overall_rating,room_cleanliness,staff_service,amenities,value_for_money,location
2023-01-05,H001,4.2,4.5,4.0,3.8,4.1,4.5
2023-01-12,H002,3.8,4.0,3.5,3.9,3.7,4.2
2023-01-20,H003,4.5,4.7,4.6,4.3,4.2,4.8
2023-02-03,H001,3.9,4.2,3.7,3.6,3.8,4.4
2023-02-15,H002,4.1,4.3,4.0,4.1,3.9,4.3
2023-02-28,H003,4.3,4.5,4.4,4.2,4.0,4.6
2023-03-10,H001,4.0,4.3,3.8,3.7,3.9,4.5
2023-03-22,H002,3.7,3.9,3.6,3.8,3.5,4.1
2023-04-05,H003,4.4,4.6,4.5,4.1,4.1,4.7
2023-04-18,H001,4.1,4.4,3.9,3.8,4.0,4.6
2023-05-01,H002,3.9,4.1,3.8,4.0,3.6,4.2
2023-05-15,H003,4.6,4.8,4.7,4.4,4.3,4.9
2023-06-02,H001,4.3,4.6,4.1,4.0,4.2,4.7
2023-06-20,H002,4.0,4.2,3.9,4.1,3.8,4.3
2023-06-30,H003,4.5,4.7,4.6,4.3,4.2,4.8

9. Review and Iterate
- Analyze the agent's responses, code outputs, and generated visualizations
- If necessary, adjust the agent's instructions or settings and prepare again


10. Additional prompt testing
- Perform testing with below prompts for additional analysis and visualizations Using the customer satisfaction data provided above, perform the following tasks:
- Create a bar graph showing the average overall rating for each hotel (H001, H002, H003). The graph should have the hotel IDs on the x-axis and the average overall rating on the y-axis.
- Generate a heatmap that displays the correlation between different satisfaction factors (room_cleanliness, staff_service, amenities, value_for_money, location) and the overall_rating.
- Calculate and print the average scores for each satisfaction factor across all hotels.
- Identify the hotel with the highest average overall rating and provide its average scores for each satisfaction factor.
- Create a line graph showing the trend of overall ratings over time for each hotel.
- Ensure that all graphs are clearly labeled and easy to read. After generating the visualizations and performing the analysis, provide a brief interpretation of the results, highlighting key findings and any notable trends or patterns in the data.
C. Create an agent integrated with Bedrock Knowledge Bases and attach Action Group (Advance) (Sử dụng code & IaC triển khai hạ tầng)
Trong phần C này, chúng ta sẽ tạo Agent với vai trò giống như nhân viên nhà hàng, có thể trả lời câu hỏi từ khách hàng liên quan đến Menu nhà hàng và thực hiện đặt bàn, Agent tương tác với cơ sở dữ liệu.
Agent Architecture
Kiến trúc mô phỏng một nhà hàng Nhật Bản sử dụng AI Agent tích hợp mô hình ngôn ngữ lớn (LLM) + RAG để phục vụ khách hàng. Agent có thể xử lý cả hai loại tác vụ:
- Trả lời câu hỏi khách hàng
- Thực hiện tác vụ cụ thể (đặt bàn)

- Khách hàng nhập câu hỏi (User question): Người dùng gửi yêu cầu cho hệ thống (như đặt bàn hoặc hỏi về thực đơn).
- Restaurant Agent xử lý:
- Agent nhận câu hỏi, phân loại:
- Nếu tác vụ là đặt bàn, agent chuyển tiếp tới Tables booking Action Group.
- Nếu tác vụ là hỏi thông tin menu, agent truy cập vào Menus Knowledge Base.
- Thực hiện đặt bàn (Tables booking Action Group):
- Agent gọi hàm Lambda (Action Group Lambda function) xử lý đặt bàn.
- Lambda tương tác trực tiếp với cơ sở dữ liệu Amazon DynamoDB để kiểm tra, cập nhật trạng thái đặt bàn và trả về kết quả.
- Truy vấn thông tin Menu (Menus Knowledge Base):
- Agent truy cập vào cơ sở dữ liệu tri thức (knowledge base) lưu tại Amazon OpenSearch Serverless.
- OpenSearch thực hiện tìm kiếm và trả về dữ liệu liên quan làm ngữ cảnh (context). Dữ liệu được lưu trữ trong bucket trên Amazon S3.
- Phản hồi về khách hàng (LLM Response): Sau khi thực hiện truy vấn dữ liệu (hoặc hoàn thành tác vụ), agent sẽ sử dụng mô hình ngôn ngữ lớn (LLM) để tạo ra phản hồi phù hợp gửi về cho khách hàng.
Các dịch vụ AWS sử dụng trong kiến trúc này:
- AWS Lambda: Chạy các tác vụ logic, xử lý nghiệp vụ như đặt bàn.
- Amazon DynamoDB: Lưu trữ thông tin trạng thái đặt bàn.
- Amazon OpenSearch Serverless: Cung cấp khả năng tìm kiếm hiệu quả trên knowledge base (thông tin menu).
- Amazon S3: Lưu trữ dữ liệu tài liệu, văn bản thô cho knowledge base.
Thực hành triển khai kiến trúc / Setup AWS enviroment:
- Trong bài thực hành, sử dụng LLM Claude-Sonet 3 để làm chatbox test. Cần request access model.
- Tạo Notebook ở Sagemaker để chạy code:

- Mở Notebook khi tạo thành công.

- Thêm quyền role Notebook cho phép tương tác với OpenSearch, S3, DynamoDB, Bedrock. Ở đây mình sẽ chọn AdministratorAccess cho tiết kiệm thời gian.


- Clone code đã chuẩn bị cho bài thực hành. Click vào icon git ở bên trái màn hình, copy url git repo và nhấn nút Clone.
https://github.com/gautrucdethuong/bedrock-agent-with-knowledge-base-and-action-group.git

- Mở file "05-create-agent-with-knowledge-base-and-action-group.ipynb". Thực hiện theo từng bước được hướng dẫn trong file Notebook.

1. Import the needed libraries:
Cài đặt các thư viện ML cần thiết từ file requirements.txt
2. Create the Knowledge Base for Amazon Bedrock
- Đợi khoảng 5-7p cho đến khi hoàn tất.


- Verify các service đã tạo thành công.


3. Upload the dataset to Amazon S3
- Upload từng file trong thư mục datasets lên Amazon S3.

- knowledge_base.start_ingestion_job(): Sau khi dữ liệu được tải lên S3, hàm này sẽ khởi chạy quá trình đồng bộ (ingestion) dữ liệu từ S3 vào Knowledge Base của Bedrock. Câu lệnh
time.sleep(30) là để đảm bảo knowledge base đã sẵn sàng trước khi bắt đầu ingestion. 

3.1 Test the Knowledge Base
- Sử dụng API
retrieve_and_generate từ Amazon Bedrock để truy vấn vào Knowledge Base đã tạo trước đó. - Câu hỏi gửi tới API là: "Có 5 món chính nào trong thực đơn dành cho trẻ em?" -> Kết quả trả về là danh sách 5 món ăn chính từ thực đơn trẻ em được trích xuất từ Knowledge Base.

- Sử dụng hàm
retrieve của Amazon Bedrock để tìm kiếm dữ liệu liên quan trực tiếp từ Knowledge Base mà không dùng LLM tạo câu trả lời (khác với retrieve_and_generate). Kết quả trả về tối đa 5 kết quả liên quan nhất.

4. Create the Agent for Amazon Bedrock
4.1 Create the DynamoDB table
4.2 Create the Lambda Function


4.3 Create the IAM policies needed for the Agent

4.4 Create the Agent

4.5 Create the Agent Action Group
4.6 Allow the Agent to invoke the Action Group Lambda
4.7 Associate the Knowledge Base to the agent
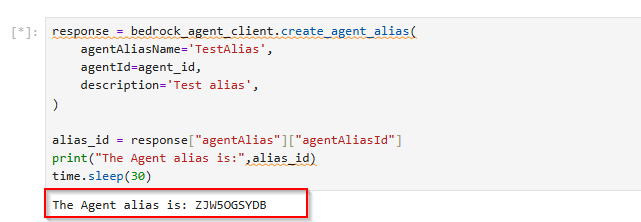
4.8 Prepare the Agent and create an alias
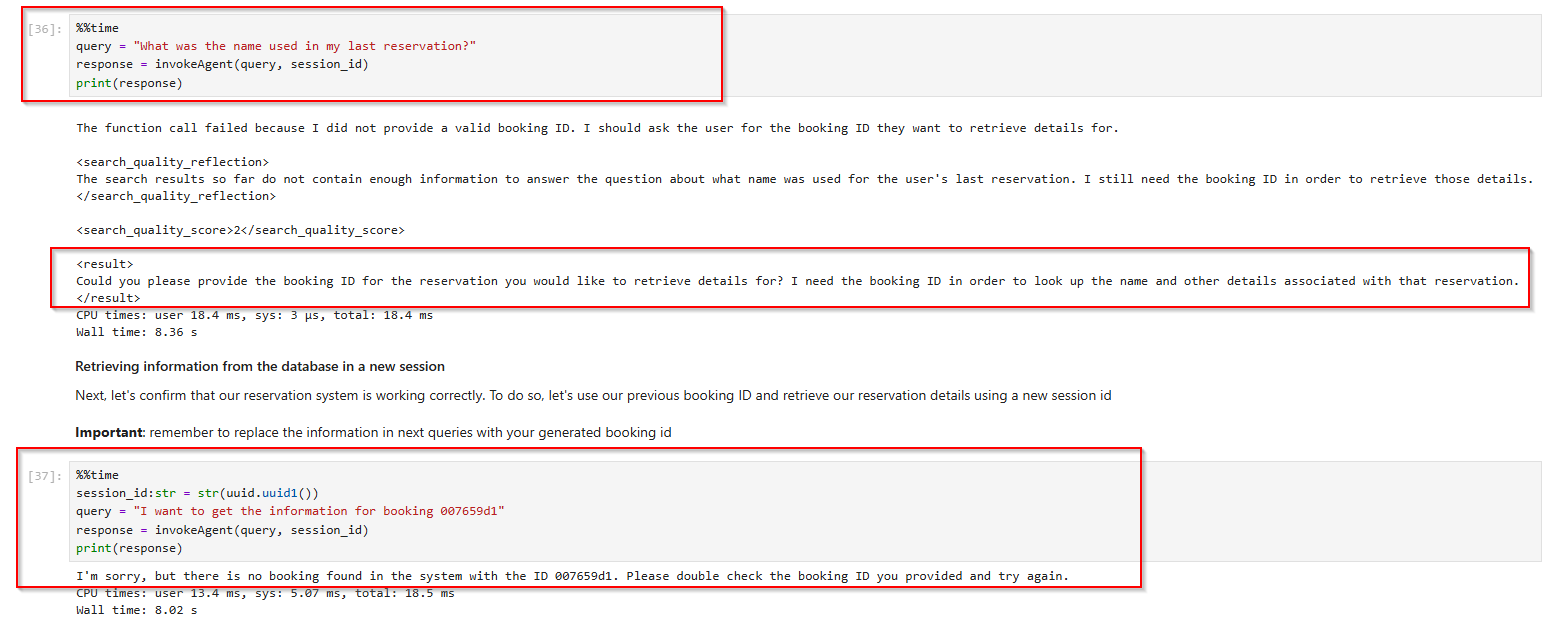
5. Test the Agent


6. Clean up resources
Chạy các cell xóa resource trong Notebook.
Xóa Notebook instance.

- Truy cập vào dịch vụ OpenSearch đã tạo ở bước 1, thực hiện xóa Collection và Index.
- Xóa Knowledge Base bên Bedrock


